S&P 500 and NASDAQ Still Below 200-Day MA

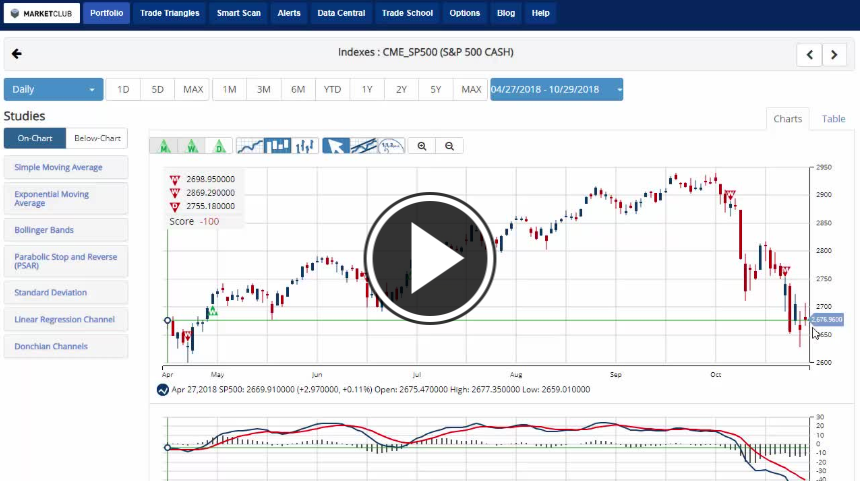
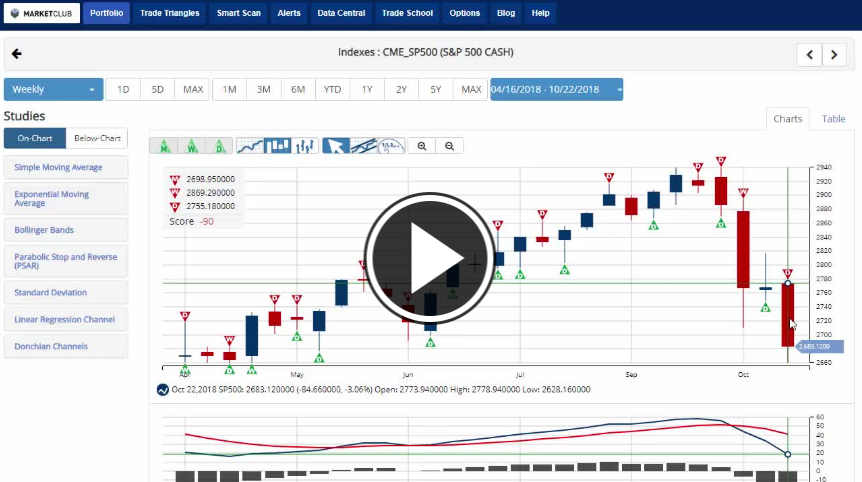
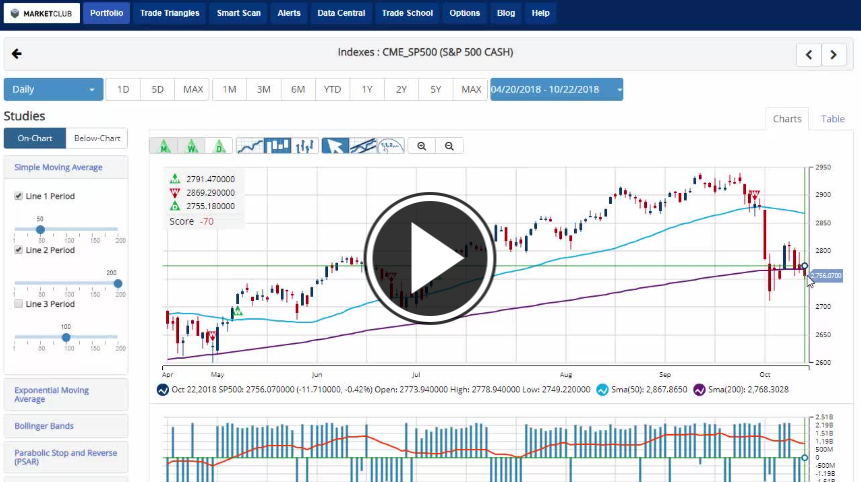
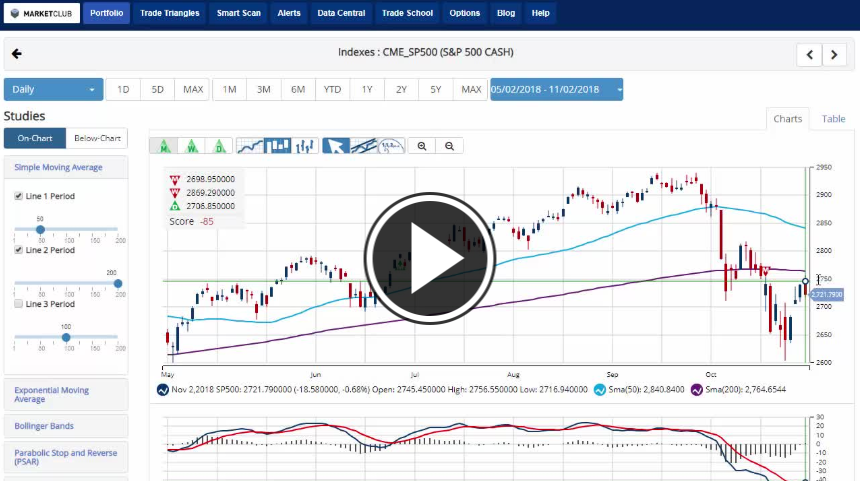
Hello traders everywhere. All three indexes are looking to post weekly gains on a nice little rally that happened this week. They were all looking to close above their respective 200-day MA's, but it looks like the S&P 500 and NASDAQ will fall just short, while the DOW is trading above it once again. Could the 200-day MA be the line of resistance for the two indexes? The last time that the indexes traded below the 200-day was back in December of 2015 and that trend lasted until March of 2016. We could be in for a rough close to the year if history holds true.

As we stand in early afternoon trading on Friday the S&P 500 is looking at posting a weekly gain of +2.3%; the DOW stands at +2.3% and the NASDAQ checks in with an increase of +2.7% even as Apple Inc. (APPL) missed earnings and is putting pressure on the tech sector losing roughly 6% on the day.

s&p 500

The U.S. Dollar and Gold continue to track each other consistently and are both relatively unchanged on the week. On the opposite side of trading, crude oil has dipped to its lowest levels in six months issuing a new red monthly Trade Triangle indicating that long-term trend has turned negative. Oil is posting a -6.6% loss on the week making this four straight weeks of declines. The reason for the drop is an abundance of oil in the world market which is relieving tensions over the coming Iranian sanctions by the U.S. Continue reading "S&P 500 and NASDAQ Still Below 200-Day MA"

Spooky October Comes To An End

Hello traders everywhere. Happy Halloween! I hope that everyone has a safe and fun time with your friends and family. While the stock market currently has the best two-day gain since June of 2016 to close out October we need to remember that overall this has been a terrible month.

Even with the first back to back daily gains of October the S&P 500 will lose roughly 6.4% posting its first monthly loss in six months. -4.6% is the number for the DOW this month, while off the lows the month this is the first monthly loss in three months. The DOW is the only index of the three to have a green monthly Trade Triangle in play still, but our key level to watch is a touch higher at 24,122.23 where a red monthly Trade Triangle will trigger. The NASDAQ has suffered the most losing 8.6+ on the month, that will give the NASDAQ back to back losing months, which last occurred in March of this year.

October

Of the instruments that I watch daily the U.S. dollar and gold the only two to have a positive month with the dollar gaining 2.2% and gold having its best month in eight months posting a gain of almost 2%. On the flip side, crude oil is having its worst month since 2015, losing nearly 10% on the month. Continue reading "Spooky October Comes To An End"

Monday Morning Market Rally Fades

Hello traders everywhere. The Monday morning market rally in the U.S. market faded as we entered afternoon trading with evaporating tech gains leading the way which leaves the Nasdaq on track for its the worst monthly loss in ten years. The NASDAQ had been up as much as 1.7% on the day before Netflix (NFLX), and Amazon (AMZN) collapsed, both falling over 3% on the day.

However, the S&P 500 and DOW are back in positive territory for the year, if only just and albeit off their session highs. Although the stock market is in positive territory, for the most part, the S&P 500 hasn't had back to back daily gains all month, and that's been rare for the DOW.

If this Monday morning market rally can make it to the end of the day will it continue into tomorrow? Or will the pattern repeat?

Monday Morning Market Rally

Key Events On Tap This Week:

Continue reading "Monday Morning Market Rally Fades"

Tech Losses Continue To Weigh On Market

Hello traders everywhere. For most of the year, the tech sector was the belle of the ball and the one sector that was driving the stock market to record highs. But this dance may be coming to an end as we enter the fall earnings season. The S&P 500 is poised to enter into correction territory joining the NASDAQ after earnings reports from Alphabet and Amazon fell short of expectations.

Amazon (AMZN) tumbled over 8% after it missed quarterly sales estimates and gave a below-par holiday-season sales forecast, that sparked a 3% plunge in the S&P consumer discretionary sector. Alphabet (GOOG) sank 4% after its revenue missed estimates, refreshing concerns that regulatory scrutiny and competition could slow down its scorching pace of growth.

weekly losses

It's been quite a week for the major indexes with wild swings higher and lower, but at the end of the week, all three indexes are going to post deep losses and resuming the current downturn after a brief respite last week. The S&P 500 will post a weekly loss of -3.5%, the DOW -2.5% and not to be forgotten the NASDAQ will post a weekly loss of -3.2%. Continue reading "Tech Losses Continue To Weigh On Market"

All For Naught When It Comes To Stock Market

Hello traders everywhere. As the slide to lower levels continued on Wednesday, I couldn't help but notice that these current levels looked familiar to me, so I did some investigating. I started by looking at yearly charts for the three main indexes, and it became quite clear as to why those levels looked familiar. As it stands, the S&P 500 is only 19 pts away from the opening of trading on Jan. 2, 2018 where it opened at 2,683.73, currently trading around the 2700.00 level. The DOW is only 180 pts away for it's yearly open at 24,809.35, currently trading around the 25,000 level. Meanwhile, the NASDAQ has quite a bit more room between its current trading levels at the 7,200 range and its yearly open of 6,937.65 or 332 pts. But the way it's been getting hammered lately case in point today, it won't take long for it to reach that level if the slide continues.

Does this mean that all of the record highs that we've seen this year are all for naught?

yearly open

Key Levels To Watch This Week:

Continue reading "All For Naught When It Comes To Stock Market"