
High-growth tech stocks have had to bear the consequences of the Federal Reserve’s aggressive rate hikes since last year. Amid concerns of a recession, most tech stocks have suffered a correction in their share prices due to fears of softening demand.
However, with continued digital transformation and the growing interest in AI, the tech industry is well-positioned to grow.
Earlier this year, Fed Chair Jerome Powell said the “disinflationary process” had begun. However, inflation still remains above the central bank’s comfort level, as evidenced by February’s CPI report.
The Fed has indicated that it intends to hike rates higher than previously predicted.
Although the recent bank failures are likely to stop the Fed from undertaking a bigger rate hike at the policy meeting, it is expected to return to its hiking spree once the banking crisis eases.
However, that should not make investors stay away from quality tech stocks.
Wedbush analyst Dan Ives believes that cost-cutting by major tech giants will likely show improved profits this year. The recent banking crisis made investors count on reliable tech stocks, as is evident from the tech-heavy Nasdaq Composite’s 13.3% increase year-to-date and 3.2% gain over the past month. According to Gartner, worldwide IT spending is expected to rise 2.4% year-over-year to $4.50 trillion in 2023.
Several technical indicators look positive for Microsoft Corporation (MSFT) and Salesforce, Inc. (CRM), so it may be worth investing in these stocks now.
Microsoft Corporation (MSFT)
MSFT develops, licenses, and supports software, services, devices, and solutions worldwide. The company operates in three segments: Productivity and Business Processes, Intelligent Cloud, and More Personal Computing. It has a market capitalization of $2.03 trillion.
MSFT’s revenue grew at a CAGR of 15% over the past three years. Its net income grew at a CAGR of 15% over the past three years. In addition, its EBIT grew at a CAGR of 19.2% in the same time frame.
In terms of trailing-12-month gross profit margin, MSFT’s 68.16% is 35.9% higher than the 50.17% industry average. Likewise, its 47.99% trailing-12-month EBITDA margin is 386.5% higher than the industry average of 9.87%. Furthermore, the stock’s trailing-12-month Capex/Sales came in at 12.14%, compared to the industry average of 2.44%.
In terms of forward EV/S, MSFT’s 9.65x is 257.9% higher than the 2.70x industry average. Its 9.94x forward P/B is 173% higher than the 3.64x industry average. Likewise, its 9.75x forward P/S is 268.9% higher than the 2.64x industry average.
For the second quarter ended December 31, 2022, MSFT’s total revenues increased 2% year-over-year to $52.75 billion. The company’s adjusted net income declined 7% year-over-year to $17.37 billion. Also, its adjusted EPS came in at $2.32, representing a decrease of 6% year-over-year.
MSFT’s EPS and revenue for the quarter ending March 31, 2023, are expected to increase 0.6% and 3.5% year-over-year to $2.23 and $51.08 billion, respectively. It has a commendable earnings surprise history, surpassing the consensus EPS estimates in three of the trailing four quarters. The stock has gained 14.2% year-to-date to close the last trading session at $273.78.
MSFT’s stock is trading above its 50-day and 200-day moving averages of $252.30 and $252.51, respectively, indicating an uptrend.
According to MarketClub’s Trade Triangles, MSFT’s long-term trend has been UP since February 2, 2023. In addition, its intermediate and short-term trends have been UP since March 14, 2023.
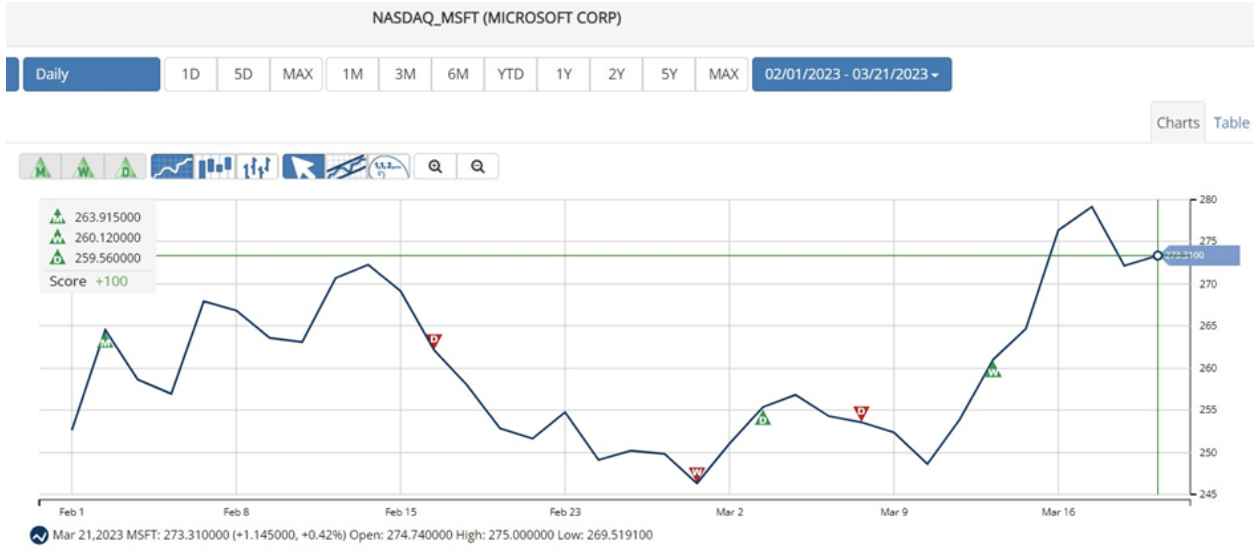
The Trade Triangles are our proprietary indicators, comprised of weighted factors that include (but are not necessarily limited to) price change, percentage change, moving averages, and new highs/lows. The Trade Triangles point in the direction of short-term, intermediate, and long-term trends, looking for periods of alignment and, therefore, intense swings in price.
In terms of the Chart Analysis Score, MSFT scored +100 on a scale from -100 (strong downtrend) to +100 (strong uptrend), indicating that the uptrend will likely continue.

The Chart Analysis Score measures trend strength and direction based on five different timing thresholds. This tool considers intraday price action; new daily, weekly, and monthly highs and lows; and moving averages.
Click here to see the latest Score and Signals for MSFT.
Salesforce, Inc. (CRM)
CRM is a customer relationship management technology provider. The company’s Customer 360 platform enables its customers to work together to deliver connected experiences. It has a market capitalization of $188.68 billion.
On January 12, 2023, Walmart Commerce Technologies announced its partnership with CRM to provide retailers with technologies and services that power frictionless local pickup and delivery for shoppers everywhere.
CRM’s Executive VP, Alliances & Channels, Tyler Prince, said, “Salesforce is thrilled to partner with Walmart as it transforms its business and further expands into the digital technology market.”
“Through this partnership with Salesforce, Walmart can grow its business in new ways by productizing its proven retail processes – empowering other retailers to create new and personalized experiences for their customers,” he added.
CRM’s revenue grew at a CAGR of 22.4% over the past three years. Its net income grew at a CAGR of 18.2% over the past three years. In addition, its EBIT grew at a CAGR of 58.9% in the same time frame.
CRM’s 73.34% trailing-12-month gross profit margin is 46.2% higher than the 50.17% industry average. Likewise, its 17.34% trailing-12-month EBITDA margin is 75.8% higher than the 9.87% industry average. Furthermore, the stock’s 32.60% trailing-12-month levered FCF margin is 436.4% higher than the 6.08% industry average.
In terms of forward Price/Sales, CRM’s 5.45x is 106.2% higher than the 2.64x industry average. Its 5.52x forward EV/Sales is 104.7% higher than the 2.70x industry average. On the other hand, its 2.92x forward P/B is 19.9% lower than the 3.64x industry average. Likewise, its 1.10x forward non-GAAP PEG is 32.8% lower than the 1.64x industry average.
CRM’s total revenue for the fourth quarter ended January 31, 2023, increased 14.4% year-over-year to $8.38 billion. Its non-GAAP income from operations rose 123.3% year-over-year to $2.45 billion. The company’s non-GAAP net income increased 96.4% year-over-year to $1.66 billion. In addition, its non-GAAP EPS came in at $1.68, representing an increase of 100% year-over-year.
Analysts expect CRM’s EPS and revenue for the quarter ending April 30, 2023, to increase 64.5% and 10.2% year-over-year to $1.61 and $8.17 billion, respectively. It surpassed Street EPS estimates in each of the trailing four quarters. The stock has gained 42.3% year-to-date to close the last trading session at $188.68.
Trade Triangles show that CRM has been trending UP for all three-time horizons. The long-term for CRM has been UP since January 27, 2023, while its intermediate-term trend has been up since March 2, 2023, respectively. Its short-term trend has been UP since March 14, 2023.
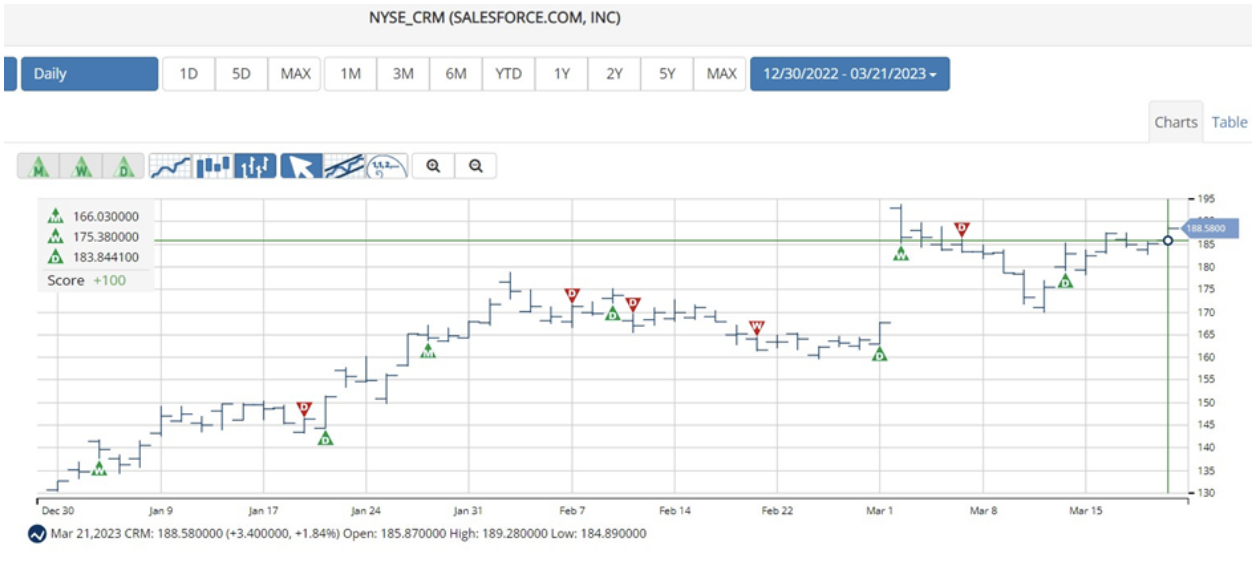
In terms of the Chart Analysis Score, CRM scored +100 on a scale from -100 (strong downtrend) to +100 (strong uptrend), indicating that the uptrend will likely continue.
Click here to see the latest Score and Signals for CRM.
What's Next for These Tech Stock?
Remember, the markets move fast and things may quickly change for these stocks. Our MarketClub members have access to entry and exit signals so they'll know when the trends starts to reverse.
Join MarketClub now to see the latest signals and scores, get alerts, and read member-exclusive analysis for over 350K stocks, futures, ETFs, forex pairs and mutual funds.
Best,
The MarketClub Team
su*****@in*.com