Traders Toolbox: Traders Toolbox: Divisions of eight

Studying the writings of traders who were active in the first three or four decades of this century has often inspired me to do additional research. This has allowed me to develop additional tools and theories. In reality, what I present in this segment will not "pure" Gann. Instead, I will present applications and approaches which I have found to be useful and successful. Hopefully, this will provide a foundation for anyone who wants to study further on his/her own.

Many of the successful traders from the first half of this century have a reputation of being almost mystical. To many, this is especially true of W.D. Gann. Trader after trader has searched for Gann's "secret" to unlock the mysteries of the market. Many of his tools, and mine as well, are relatively simple and are not secrets. However, after delving into his writings, I have come to the conclusion that his biggest "secret" consisted of two things: HARD WORK and COMMON SENSE. Unfortunately, many would-be traders seem unwilling to do the first and lack the ability to use the latter.

Probably the easiest place to start explaining analytical tools is with a simple method to determine support and resistance levels. To locate what should be among the most important areas of support and resistance in a market, divide the move from one extreme to the other by eight.

As an example, oats posted a high in the summer of 1988 which may hold for some time to come. The monthly oats chart shows the range from the all-time low near 14 posted in 1932 to 393, the 1988 high, divided by eight. These eight points should prove to be important areas of support and resistance for years to come. One way to check this range is to examine whether the eight points have proven significant in previous action. In the oats, it is fairly clear the eighth points have been effective in previous years, which should give one a high degree of confidence these levels will be important in the future.

Gann indicated that the 1/3 and 2/3 divisions of a range (broken lines on monthly oats chart) were important as well. I have found the 1/3 and 2/3 points to be significant, but they will generally take a secondary role to the eighth points.

The divisions of price, primarily the eighth points, can be placed on not only the long-term monthly and weekly charts but on the daily charts as well. As the daily perpetual chart of December oats reveals, the long-term levels of support and resistance are significant to daily action. It was no surprise to see December oats find support at the 250 level as manifested during July and August, 1988. Since the point of the all-time range at 250 had been clearly broken, one would have expected to see this market fall to the level near 202 (which it later did).

The divisions of a range are not limited to the move from all- time low to all-time high. Any sizable range of movement can be divided by eight to determine lesser-degree levels of support and resistance. Note the upmove in 1991 in December silver from February to early June. Following the June high, the eighth points provided reasonable areas of support and resistance on the ensuing decline. The boxed area on the weekly December silver chart represents the action shown on the daily chart. The weekly chart didn't indicate this range was very significant, essentially a corrective rally; yet, the eight divisions still provided valuable reference points.

The power of this tool is obvious.The large-degree eighth points are invaluable as reference tools for support and resistance. Yet, the same principle we'll work on daily charts, smaller ranges and, yes, even intraday charts.

Credit to Glen Ring for this work

Traders Toolbox: More basic Gann

One of the most important ways a contestant can prepare for competition is to know as much about the opponent as possible. In trading commodities, the primary opponent is the trader's own emotions. Once the emotions are under control, the "opponent" is the marketplace.

Know your market! While there are many analytical tools which may be applied to all markets, not all markets are identical. Markets have individual personalities or tendencies. It is important to study individual markets to learn specific identities.

A clear example of individuality is seen in seasonal patterns. The seasonal tendencies of each commodity are somewhat unique. Identifying a historical pattern can be very beneficial in the process of trade selection. To illustrate, a study of the monthly corn chart reveals March is a poor month in which to initiate a major short position.

With the exception of 1977, since 1972, a sale made in the corn market during March could have been bettered by waiting until later in the year. While impressive on the monthly corn chart, this pattern is even more clear for the December contract (not shown). How is such information applied?

Corn Belt farmers typically face a large portion of production expenses from late February through early April. Obviously, corn is a primary source of income for these producers and the need to generate capital spurs sales of corn in the period of need. By knowing March is a low probability month for favorable prices, plans can be made to market corn prior to the period of seasonal weakness or to postpone sales into later months. Also, producers should avoid selling the new crop (December) during March as the probability of selling at equal or higher prices later in the season is 100 (since 1972).

The applications for traders are rather obvious. If a trader is bearishly inclined, the information would suggest patience needs to be exercised to wait for a higher period of probability to initiate a short position. Bullish traders would try to accumulate long positions during March.

Seasonal tendencies are only one of many individual traits to study. Many markets have certain types of top or bottom formations which occur more often than not. For example, soybeans generally post some form of a triple top when marking a major high. Some markets respect support or resistance levels much better than others. Certain markets like to post a high percentage of turns on a specific day of the week or month. The list goes on.

There is only one way to learn market tendencies: study and study some more. Through hard work comes knowledge. W.D.Gann stated the importance of knowledge very well: "The dif- ference between success and failure in trading commodities is the difference between one man knowing and following fixed rules and the other man guessing. The man who guesses usually loses."

Traders Toolbox: Forward to Gann theory

To TRULY be a success at almost any profession takes commitment — the type of commitment which comes from the heart, not the mind. Most successful people I know have a dedication towards their chosen path which was forged through hunger. Hunger for knowledge, hunger for power, hunger for wealth, and, in many instances, the hunger associated with survival. It's hard to be "rich" if you haven't been "poor"; "happy" if you haven't been "sad"; or "satisfied" if you haven't been "hungry".

I believe Gann's biggest secret consisted of hard work and common sense. Hard work follows a true commitment and a desire to learn. Common sense is sharpened by the process of learning from experience. In my opinion, THERE IS NO SUBSTITUTE FOR HARD WORK AND AN OPEN MIND.

In trading commodities, a critically important early step towards success is learning about yourself and how you function. You can learn about yourself quickly in the marketplace. By far, the weakest tool in a trader's arsenal is the TRADER. In this business, it is so very true that you are your own worst enemy. It is critical to understand yourself and to bring your emotions under control.

Emotions are tamed by confidence. Confidence is gained by knowledge. Knowledge is achieved by dedication to study and willingness to learn from experience. The entire process takes persistence. Persistence is fed by desire and hunger. You stay hungry by realizing and believing there will always be more to learn Never reach the point where you consider yourself an "expert" instead of a student. Stay humble, lest the markets humble you.

Become an independent thinker. Don't concern yourself with what "they" say. Don't conform your opinions for the sake of conformity. I constantly tell myself, "don't take the advice of another unless you know they know more than you know. Dare to be a success without fearing failure.

Do not apologize for failures nor be embarrassed by them. Instead view failures as an opportunity to learn. Much more will be learned from losing trades than from winning trades. Failures are a challenge of your commitment and can make you stronger if you will meet the challenge. Failures are the fuel to keep the hunger burning.

Through the learning process, you will develop the important patience and discipline needed to become a winner. In his book, "How to make Profits in Commodities", which I highly recommend, W D Gann listed 28 rules for success in the commodity markets. The vast majority of these deal with money management and/or mental discipline. Some of the sharpest analysts I know are not successful traders because they cannot overcome their own mental weaknesses.

Success does not come easily, nor should it. I CANNOT OVER EMPHASIZE the importance of mental preparation and self-examination. As an additional aid, I suggest Rudyard Kipling' s poem If.

Price Analysis – A Top-Down Approach

Today I'd like everyone to welcome Lance Beggs from Your Trading Coach.com. Over the past few months I've gotten to know Lance, his site, and his teachings. Overall I'd say he ranks up there with Adam when it comes to his genuine desire to help traders. I've asked him to come and teach us a little about price analysis. Enjoy!

================================================================

Hi MarketClub traders,

Many thanks to Trader's Blog and Adam for the invitation to write today’s Guest Blogger entry.

One of the key features in my analysis involves monitoring price action, in order to gain an insight into the short term sentiment of the market. Determining who is in control at that time – the bulls or the bears, and assessing how they’re likely to respond to changes in the market.

I thought today I’d prepare a quick article to give an overview of how I analyze price. Those of you who know me know that I’m a great fan of candlestick charting. However, price analysis is much more than just watching for your favorite candlestick patterns. Too many people just teach the candlestick patterns, which are fine, but in my opinion there’s some essential analysis missing that an astute trade needs to consider BEFORE they look at price action and respond to every candlestick or bar chart pattern. Let’s have a look at what I mean.

Price analysis for me is essentially a top down approach, working from the macro level of Market Structure (so we analyze the big picture first), then down to the current Trend within that structure, and only then do we look at the current price pattern, whether through candlestick analysis or whatever other method works for you.

So I basically start off with a wide view of the market, and drill down to the detail in the current price bar or pattern. I prefer to do this over two timeframes.

The market structure is defined primarily on a higher timeframe. For me, as a daytrader, that’s the one hour charts. Of course, if you trade differently to me then that can be any other time period you wish. Just make it higher than the timeframe you trade on – I recommend by at least a factor of four.

Then on the shorter timeframe (what I call the trading timeframe) I refine the market structure a little further, analyze the movement and strength of the trend, and then assess the bullish or bearish sentiment based on the current price patterns.

For me, the trading timeframe’s anywhere from 1 minute to 5 minute charts, depending on the market and its volatility, and how well the price is flowing.

So, what do I mean by market structure, trend analysis and price analysis?

Firstly Market Structure:

(a) The higher timeframe chart is opened and any areas of major support or resistance are identified and clearly marked on the chart.

(b) Support & Resistance for me are areas of past price congestion, swing highs or lows, or gaps. That doesn’t include any ‘guessing’ at future support or resistance, via the use of pivots points or Fibonacci levels. I’m not a fan of these analysis techniques. Of course, if they work for you, good on you, keep using them.

(c) My expectation when I trade is that there is a higher probability of price stalling or reversing at these areas of major support or resistance.

(d) I then narrow my focus to the shorter trading timeframe and add to the market structure framework, by identifying areas of minor support or resistance. (Typically we look on the current trend first, but you may at times need to look back beyond the current trend, to previous market action, to find applicable areas of minor support or resistance)

(e) Once again, these come from areas of congestion, swing highs or lows, or gaps. That is, areas which are proven to stall price movement or reverse price direction. My expectation with minor support or resistance is for a higher probability of minor support holding in an uptrend, and minor resistance holding in a downtrend.

That’s it for Market Structure – simply identifying a support and resistance framework within which price moves. Simple!

Having defined our market structure, or a framework within which price will move, we now focus our attention on the current trend. This occurs, as does all further analysis, on the trading timeframe.

(a) I conduct analysis on the trend to identify its strength. Is the trend moving strongly, in which case we can anticipate it being more likely to break through the next support or resistance levels, or is it weakening, in which case we have a greater probability of the support or resistance levels forming a barrier to further price movement?

(b) We determine the strength of the trend by looking at its proximity to the support and resistance barriers within the framework, and also gain clues from changes in momentum or volatility.

(c) Is the current price swing, faster or slower than preceding swings within that trend? Is the current price swing speeding up, or slowing down?

(d) Is the volatility changing? Is the average range of the price bars increasing or decreasing?

(e) These sorts of questions regarding changes of volatility and momentum can give you clues into the changing strength of the trend, and the likelihood of a reversal at, or continuation through, an area of support or resistance.

(f) If you want to get experienced at this, it takes time. Review price charts over and over, identifying how changes of momentum and volatility precede either a continuation or reversal of that trend.

Having gained an appreciation of the strength of the trend, and its location within the support and resistance framework, ONLY THEN, finally, do I concern myself with the current price action to determine the bullish or bearish sentiment (or more particularly a potential change of sentiment) through candlestick analysis.

What does this little bit of extra work give me?

Here are a couple of examples:

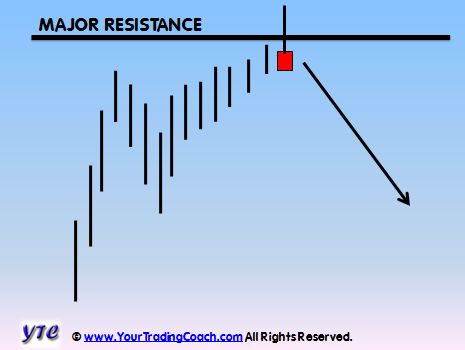
In the diagram above, instead of entering short on a shooting star reversal pattern, just because it matches the shooting star diagram in my book on candlestick patterns, I’m entering short because price just meandered slowly up to a major resistance level. The current price swing has clearly less momentum than both the previous upswing and downswing. And the price bar range is clearly narrowing. This gives a reduced likelihood of the commitment required from the bulls to break through the area of increased supply. The shooting star pattern provides evidence of a clear rejection of prices at that resistance level. This provides me with a lower risk or higher probability trade in the short direction.

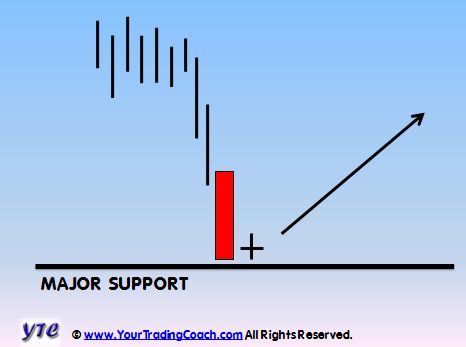
Again, in the diagram above, instead of entering long on a harami cross reversal pattern, just because it matches the harami cross in my book on candlestick patterns, I’m entering long because a strong and accelerating move downward, on greatly increased volume, extended price rapidly to great distances below its average, right into an area of major support. This is an area where I expect increased demand is likely to be sufficient to absorb and overcome the force of the bears who have spent all their energy on the climactic move downwards. This is an area where I expect price to find support. The harami cross shows a clear halting of the rapid move down, and allows me an opportunity to enter a low risk trade close to an area of major price support.

Seriously, the end result might be the same, but at least I’ve entered based on a reasonable assessment of the price action in order to maximize the potential for a lower risk or higher probability trade. Over a lifetime of trading I expect this approach will produce more favorable results than just entering because the pattern matched one I’d memorized from a book.

Ok, time for a bit of a summary. Don’t just blindly take your entry triggers. Think about where they occur within the bigger picture structure of the market.

The market structure defines where you trade. The trigger, whether a candlestick pattern or some other form of entry trigger, tells you when to get in, ONLY when you’ve first met the requirements of the market structure rule.

Think about where the current price movement is within a framework of support and resistance. Think about the changing strength of the current trend, or price swing, as it approaches this area of support or resistance. Watch for signs of strength or weakness in the trend, through the clues evident in changes of momentum and volatility.

And don’t forget – ALWAYS USE STOPS, because there are no guarantees. This is a game of probabilities.

Happy trading,

Lance Beggs

Would you like to learn more about how I trade the forex and equity index markets? Check out the articles, videos and trading resources on my website right now at YourTradingCoach.com .

Tape Reading

For today's guest blog post, I've asked Kunal Vakil from MySMP.com to come back and teach us a bit about Tape Reading.

===================================================================

By Kunal Vakil, co-founder of http://www.mysmp.com/

08/12/2008

What is the Time and Sales Window?

From my experience in day trading over the last few years, my most valuable tool became the time and sales window, aka. the "Tape". The time and sales window basically shows the trader detailed information regarding the order flow for a particular security. The time and sales window provides details on each of the trades that have gone through for that security, such as: Time of Trade, Price, Size of order, and condition of order. Depending on the trading platform, you will have other data points available to you.

After mastering the message of the tape, you will be able to accurately decide when to enter and exit a trade.

How do I get access to the Time and Sales Window?

There are few brokers in the marketplace that offer the time and sales window to their customers. Typically, only trading platforms which are suited for day traders offer this option. I use Tradestation and as you can see in the image above, provides all the key elements that will allow one to effectively read the tape.

How to Use the Time and Sales Window

I am a very big believer that there are two truths in trading stocks. One is price and the other is volume. Tape reading involves both; and if used correctly, dramatically increases the odds of your trading working out. It does so due to the fact that your goal with tape reading is to follow the money.

While some professional traders may not like to admit it, trading stocks is an odds game. Your job as a trader is to put trades on with the highest odds of winning. Trading with the tape requires trading with patience. You cannot go out and buy or short a stock because you see the tape speeding up a bit. You need to be aware of support and resistance levels and also combine the message of the tape with price pattern formations.

Tape reading can be very fast and confusing at times and requires quite a bit of practice in order to get used to understanding the true meaning behind what you are seeing. Remember, every stock is a different story and tends to trade differently. It is wise to review the way in which the "tape" trades for a couple of minutes before entering a trade. Reading the tape requires you to train your eyes to scan for changes in character. I want to discuss a few of these key changes that you should take note of:

Size of Orders

Lets start with size. The size of the orders coming through will help you decide if there is conviction behind the price action you are seeing. When putting on a trade, you typically want to see a flurry of buy or sell orders which have greater than 300 to 400 shares in size. There is no hard and fast rule about this; it is more of a visual cue that your eye gets trained to recognize. Many times, I will see great technical setups in stocks that trade low volume. I stay away from these setups as the message of the tape is not as clear and this lowers my odds of a winning trade.

Order Speed

The speed of the orders is another key component to the message that the tape is giving you. Typically, when stocks breakout through support or resistance levels, not only will the size of the orders go higher but you will see the tape start to speed up. This gives you an indication that there is an interest in this stock at this level and that the interest is larger than a couple small traders buying or selling.

Order Condition

Order condition refers to which side of the bid/ask spread the trade was executed on. When we go long a stock, we want to see many orders being executed at ASK. Conversely, when we go short, we want to see orders being filled at BID. This gives us a clue as how desperate traders are to get into our out of this stock.

Speaking from Experience...

Above, I have reviewed a few basic principles of tape reading but I want to discuss some of lessons I have learned throughout my years of trading that I think you will find helpful when analyzing the tape.

Which stocks are best to trade?

I have received this question many times. The answer to this question for me is simple, I only trade the most volatile stocks of the day. These stocks are the ones which will provide you with strong volume and large interest from the public. They also provide strong and fast moves which you can make larger profits from. Remember, we need to see speed in the tape and that requires a stock with public interest.

Does the tape work better during specific times of the day?

In my experience, the answer to this question is YES. I typically only trade the first 2 hours of the day. This is when the most volatility is present in the market and also when most of the trending moves are made. Typically, lunchtime becomes very choppy and has a different group of traders who are buying or selling for different reasons than the first hour. I am not ruling out trading after lunchtime, however, my results have been less than stellar when I attempted to do so.

Tape Reading with Level 2

The level 2 window provides the trader with an edge. It will show you the sizes of the orders in the market makers book. While the market makers can play games with the level 2 in order to fool traders, in general you want to see high bid sizes and low ask sizes when you go long. On the flip side, you want to see low bid sizes and high ask sizes when you go short or sell out of a stock. Again, its not foolproof but it adds to the odds of your trading winning.

Exiting a trade

This is probably the most difficult part of the trade for most traders. Tape reading helps me get out of the trade by looking for imbalances. When I see a stock moving sharply in one direction, I will immediately look to the tape to offer clues as to when the brake pads will be applied. Again, this skill will take practice to develop. If your short a stock, keep an eye out for the bid side getting heavy and the bid/ask spread widening. This could be a tell tale sign that the juice has been used up.

Bid/Ask Spread at Key Levels

Make sure that stock does not have large bid/ask spreads as it approaches your entry points. You will not have much time to place you trade and if you are trading a volatile stock, you most likely will have to execute the orders at market. Large spreads tell me two things; first, your risk increases significantly when the spread increases. Why? Because most times you will have trouble getting out of a stock with a large spread using limit orders and this can turn a small loss into a big one quite quickly. Secondly, it tells me that there is not that much interest in the stock. If there was, the spreads would narrow and both sides would come as close as possible.

Extremely High Volume Stocks

There is trading high volume and then there is trading extremely high volume. I try and stay away from stocks that trade, for example, 30 or 40 million shares as the message of their tapes can be a bit confusing at times if your a beginner. You may see 14 orders come through at bid with large sizes but that may not mean as much as if the stock was trading less volume. Remember to always keep everything in context. If your stock trades gigantic volume, you should expect a different kind of tape action.

Make price prove the point

Up to this point, we have discussed order size, speed, and condition. While these are all key components of the tape, you must let price prove the point. For example, if you are looking to short a stock at $54 and there is strong order flow selling at bid at that level, my experience has shown me to wait for that level to break. If it does not, you may be involved in a trap that was made to get the weak traders out and then take the stock in the opposite direction.

Don't let your ego get in your way

One of the biggest mistakes that I see many traders making is that they get attached to their positions. In an effort to appease their ego's, they tend to take a trade and stick with it until they are right. Remember, day trading is an extremely fast game and if you do not react with speed, you will be left in the dust. When you make a decision based on that tape action and the stock does not go in your favor relatively quickly, odds are that you are in a bad trade.

Focus

It is extremely important to have utmost focus when you are trading and trying to listen to the message that tape is giving you. Try and stay in a zone and filter out the extra noise. If you are going to put a trade on, be in that trade and nothing else. This will help you feel when it is right to stay in the stock and when its time to get out.

Conclusion

Tape reading is a very important skill to have as a short term trader and can keep you out of many bad trades. Remember, don't be an action junkie, psyching yourself up for every trade. If you do this, you will find a reason to put on bad trades in the heat of the moment. Discipline is key and it takes time to develop. For any new traders looking to try this out, please practice, practice, practice before you put your hard earned money at work. Mastering the art of tape reading will take time, but when you do, you will be rewarded.