
Taking a Look Back
With these tools in mind, let me take you back to the chart to look at how things developed in the volatility through 2007 to this point in 2009.
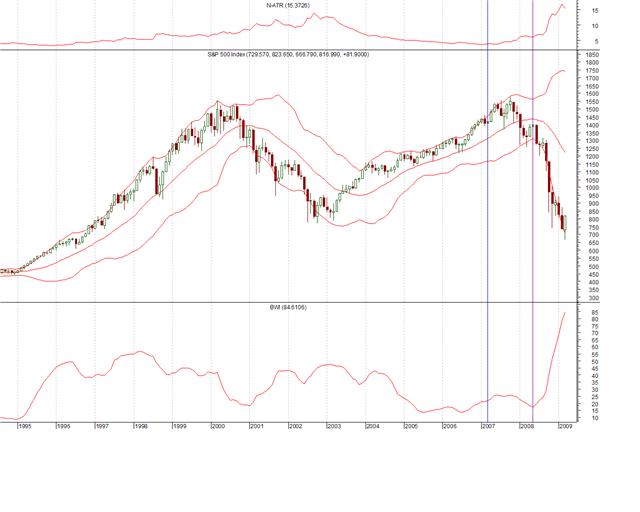
You’ll notice that I’ve drawn two vertical lines on the chart. The blue one is at the point where N-ATR started rising after having fallen for about four years. Specifically, that was March of 2007. The turn told us things were starting to get interesting.
The early stages of bull markets tend to happen with N-ATR declining. In the latter stages, as more and more people get sucked in and the excitement grows, so too does the volatility and thus N-ATR begins rising. You can see on the first chart how that happened in the 80s, 90s, and in this decade too.
The March 2007 turn in the reading was a warning sign that things were starting to shift, but also that the market probably had a bit further to run before you needed to get worried. I was writing in 2006 that the S&P was likely to make a run at 1500+ based heavily on the fact that N-ATR had not yet bottomed.
The purple line is where BWI reached a very low reading in May of 2008, after which it began widening again. That’s the point where if you weren’t already pretty sure things had turned for the worse the volatility was screaming, “Look out below!”
Bringing it Forward
At this point a couple of things tell me the S&P is near another inflection point. One is the extreme reading of BWI. That study is at its highest in decades, going back at least into the 1970s, if not further. I can, of course, go further still, but sooner than later we will see it turn down. That will probably be final confirmation that the bottom is in. Bear markets tend to operate on expanding BWI.
Simultaneously, N-ATR is also very high. Again, it can go higher still, as it did in 2002 and 2003. It’s no doubt closer to the end of its run than the beginning, however.
The weekly chart provides evidence supporting what I’m talking about.
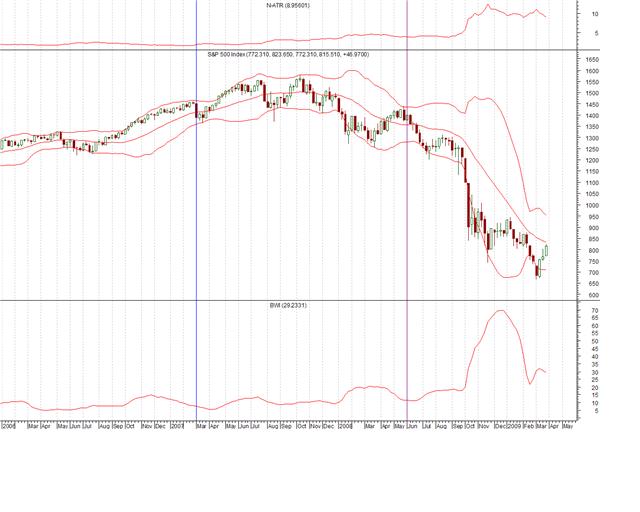
Notice above how N-ATR has gone flat and begun drifting lower after its sharp rise? That's already showing up in the month chart as a downtick for March if things hold course. Also notice how BWI dropped rapidly down from its high BWI ready. Both these things should soon start being reflected in the monthly readings.
Not Volatility Alone, Though
Of course volatility alone isn’t going to get you all the way. It’s great for warning and confirming, but not so great about specific timing. You need to employ other forms of analysis to actually develop your trading strategy. I personally use the price action relative to key support and resistance points as my timing. In a situation like this I also look at what’s going on in other markets and in the market internals to provide further evidence. All of that stuff is telling me that a long-term player would do well to be dipping his toe back into the stock market at this point.
John Forman