

At MarketClub our mission is to help you become a better trader. Our passion is creating superior trading tools to help you achieve your goals -- no matter which way the markets move -- with objective and unbiased recommendations not available from brokers.
The Trader's Toolbox posts are just another free resource from MarketClub.
---
"MarketClub is known for our “Trade Triangle” technology. However, if you have used other technical analysis indicators previously, you can use a combination of the studies and other techniques in conjunction with the “Trade Triangles” to further confirm trends.
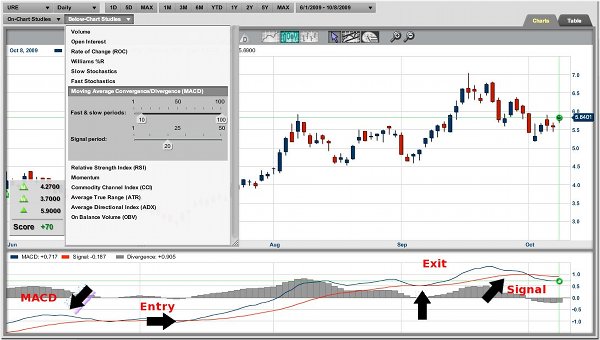
Developed by Gerald Appel, this indicator consists of two lines: a solid line called the MACD line and a solid line called the signal line. The MACD line consists of two exponential moving averages, while the signal line is composed of the MACD line smoothed by another exponential moving average..."
Revisit the Trader's Toolbox Post: "Moving Average Convergence/Divergence" here.
Jim.
I pay more attention to the MACD than to volume. Same with our Trade Triangles. Volume is important, but it's not that important in my trading plan.
All the best,
Adam
how do you use the volume with the MACD....it does lag, but as long as you catch it while in a trend, it is pretty useful, I think
Just remember that the MACD is a lagging indicator. Combine it with volume moves and you might have a more useful tool.
All,
We've had several comments on this posting about our MACD lines being wrong or crossed thus producing wrong numbers. Our colors for the Signal line and MACD line are correct. What is wrong are the numbers on the Signal and the Divergence, the two numbers are switched on the chart. The Signal number is the Divergence number and vice versa. If you check your table function on the charting you will notice that the numbers are correct.
I apologize for any for any confusion or inconvenience that this may have caused. Our Technical Team is currently working on several updates for our charting package that will include a fix for the MACD numbers.
Thank you for your patience in this matter.
Best,
Jeremy Lutz
Technical Support & Customer Service
INO.com & MarketClub
Dear Adam,
regarding MACD divergence.
Just look at USD/AUD chart, Signal line if it crosses MACD line trend reversal is noticed. If it goes up it is bullish sign & if it goes below MACD it is bearish sign. Howsoever when we look at the said chart it is altogether opposite what has been read i.e if Signal line line crosses above MACD is is bearish sign & if it crosses below it is bullish sign, Please explain me, how it is possible!
Secondly I am interested in reading charts but i cannot attend Webinar due to timing. Please guide me.
Thanks,
Bippin