
Today's guest is Stock_Analyzer from StockHideout.com, a micro cap community. Certain types of stocks have been hit harder than others lately; risky micro cap stocks have definitely taken a beating. Stock_Analyzer is going to explain the link between the NASDAQ and OTCBB and how he potentially sees some light at the end of the tunnel. Be sure to comment and let us know what you think.
=====================================================================
The financial crisis has caused stock markets worldwide to crash, sending them spiraling into a period of high volatility. As a result, a considerable number of banks, mortgage lenders and insurance companies have filed bankruptcy, spurring a loss of investor confidence in the capital markets and decreasing liquidity.
The dollar trading volume of a market is indicative of overall market conditions. It essentially shows how much money is entering or leaving the market. It is well known that the markets are very cyclical in nature and that during the growth stages investors increase their investments, while recessions leave investors looking for exit strategies.
Comparing the charts from the NASDAQ and OTCBB, we see that OTCBB trading activity tends to parallel NASDAQ activity. When times are good on the NASDAQ, investors often invest some of their profits in OTCBB stocks. When times are bad, investors are inclined to eliminate their riskiest investments. As such, if the NASDAQ is declining, the first things to go for most investors are their OTCBB investments. And it seems decreases in the NASDAQ are followed by a much faster decrease in OTCBB.
The average daily dollar trading volume, $ Million 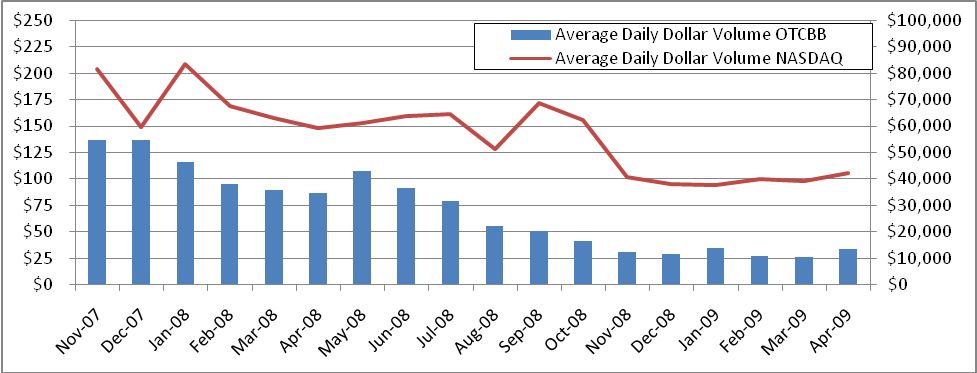
The OTCBB average daily dollar trading volume has decreased 60% during the last 12 months, from $86 million in April 2008 to $34 million in April 2009. During the same period the NASDAQ average daily dollar volume declined 28% from $59 billion in April 2008 to $42 billion in April 2009.
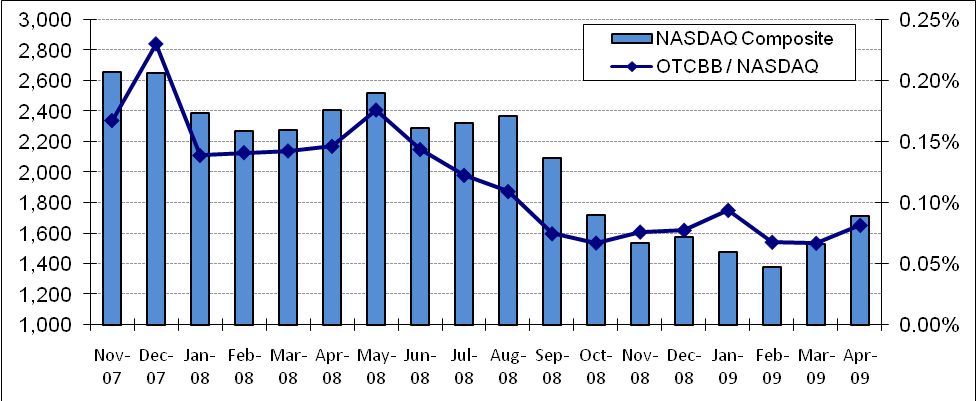
In September 2008, total dollar volume of OTCBB stocks fell to less than 0.07% of total NASDAQ dollar volume, the first time it has dropped below 0.1% since the inception of the data in 1995.
The NASDAQ Composite Index has jumped more than 25% since early March 2009 and moved back above the November 2008 lows. A number of analysts and investor strategists have expressed opinions that the market low in early March was the bottom. A recent MarketWatch.com Investors Intelligence poll showed that slightly more than one-third of financial advisers still had a bearish outlook on stocks, compared with 43% who had turned bullish .
OTCBB daily dollar trading volume as a % of NASDAQ dollar volume
The shift in investors’ expectations, paired with signs that the markets have stabilized, has increased investor confidence and will likely pump cash flows to the stock markets. The April 2009 NASDAQ average dollar trading volume was the highest since October 2008. The growth trend is likely to continue since the average trading volume approached $46 billion for the first 8 trading days of May 2009.
As gains for the NASDAQ trading volumes continue, we expect the dollar volume for the OTCBB to increase dramatically in the coming months. More money coming into the OTCBB suggests more trading activity and more opportunity for important yields.
Best,
Stock_Analyzer
=====================================================================
Stock_Analyzers knowledge of stocks and stock charts has helped him successfully build up one of the biggest stock trading communities, StockHideout.com. For more micro cap insight be sure to visit Stock_Analyzer at StockHideout.com.