
 Today I'd like to welcome Lawrence Korbus, Chief Forex Educator and Professional Trader at Tsunami-Trade.com to the Trader's Blog! Today Lawrence teaches us a little about how he enters trades and analyzes the markets. Please enjoy the article below, comment to Lawrence with your thoughts and insights, and check out Tsunami-Trade.com to see what he does!
===================================================================
I was sitting as an invited “expert trader” on a panel with 4 other traders at the 2009 Las Vegas TradersExpo last week. They called the standing room only panel discussion: “Successful Strategies for Profiting from Forex Trading.”
They asked the question of all of us, “How do you make money trading the Forex markets?” The panelists said some things about using their decades of experience to get a “feel for the market”, and then they each in turn cited several different methodologies such as trading breakouts, and using proprietary sentiment and Elliott Wave analysis to come up with “an area to trade”. They were not more specific than that on how they entered trades. Although they all differed in how they entered trades, what I found most interesting that they all had one thing in common. They all said that they would scale out of the trade as the trade hopefully went in their direction.
I have found that a very important component of my success is that I fit my trading strategy to my personality. Although I admire those who say they can pick the perfect top and bottom of a trend a trader has to know his limitations! Scaling out of a trade has also never been my cup of tea as all the analysis in the world really just boils down to nothing more than an educated guess on where a trend move might end. The problem with educated guesses is half of the time they are wrong! Since they can be wrong up to half of the time that breeds stress and uncertainty and is no way to pay the bills!
But is there an objective way to enter a trade and to know with a high degree of certainty where it will go? Here is one way to go about it. If you see a trend move occurring, measure it! What I do is I measure from the very top of a move to the very bottom of a move. When the retracement occurs, I draw a trendline along the bottoms of the retracement bars. I will enter when I see a bar closing below the trendline I just drew, and then I can measure where it will often times go! It turns out that the market is such that it will always seek symmetry. That is a 100 pip down move in the currency pairs tends to predict another 100 pip move down from the retracement high. That is a move from A to B, predicts a move from C to D.
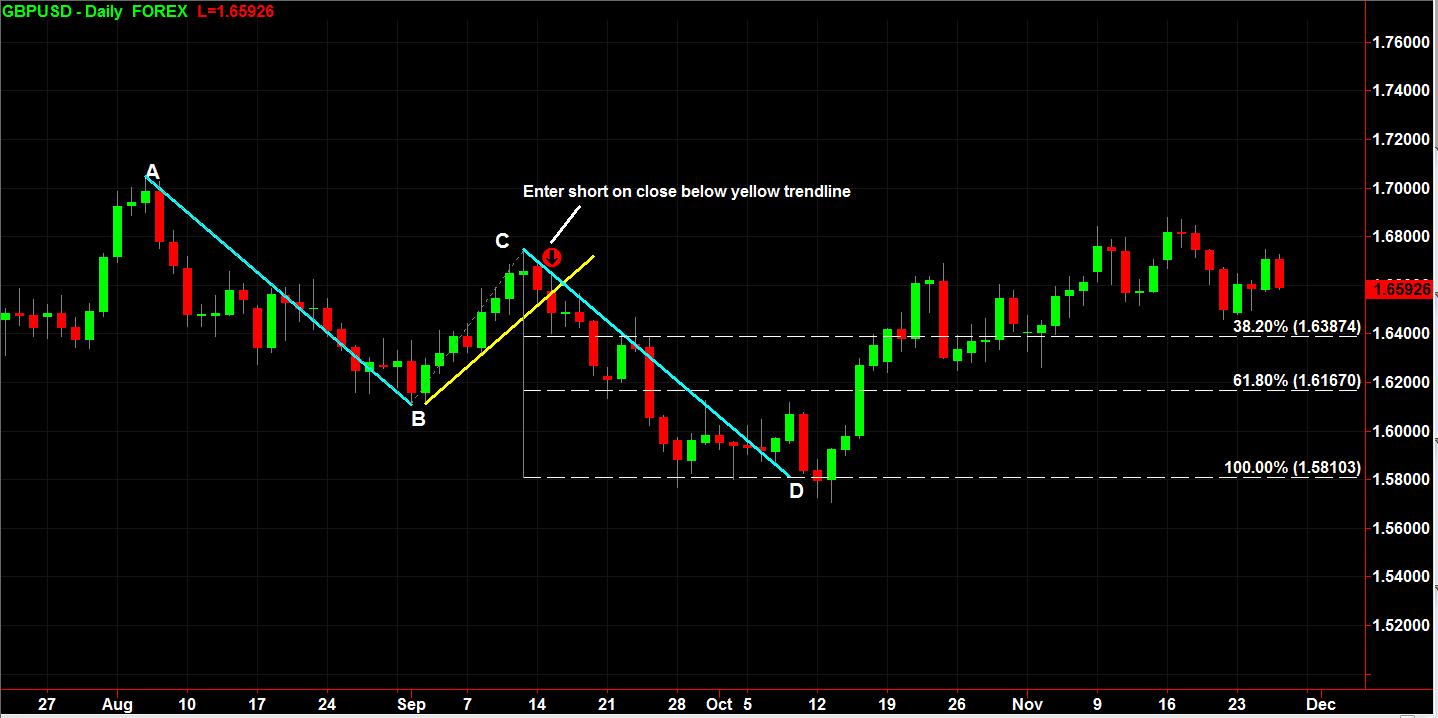
Now am I just predicting the tops and bottoms of a move just like the others? Not exactly – it’s just nice to know where the road is heading before you go on a cross-country road trip. Fibonacci can help predict where the market will get to along the way and I use the .382 and .618 extensions of the first move from A to B. (That means I am multiplying the amount of the move from A to B by .382 or .618, and subtracting that amount of pips from the high at C to predict where the market will go and where I will exit the trade with the sure money!) It is obviously much easier to reach the .382 or .618 level from C than it is to reach all the way down to point D! That sits well with my personality of wanting to take the high percentage of sure winners in my daily trading. But how can you reenter and get more of the trend move? Well just rinse and repeat!
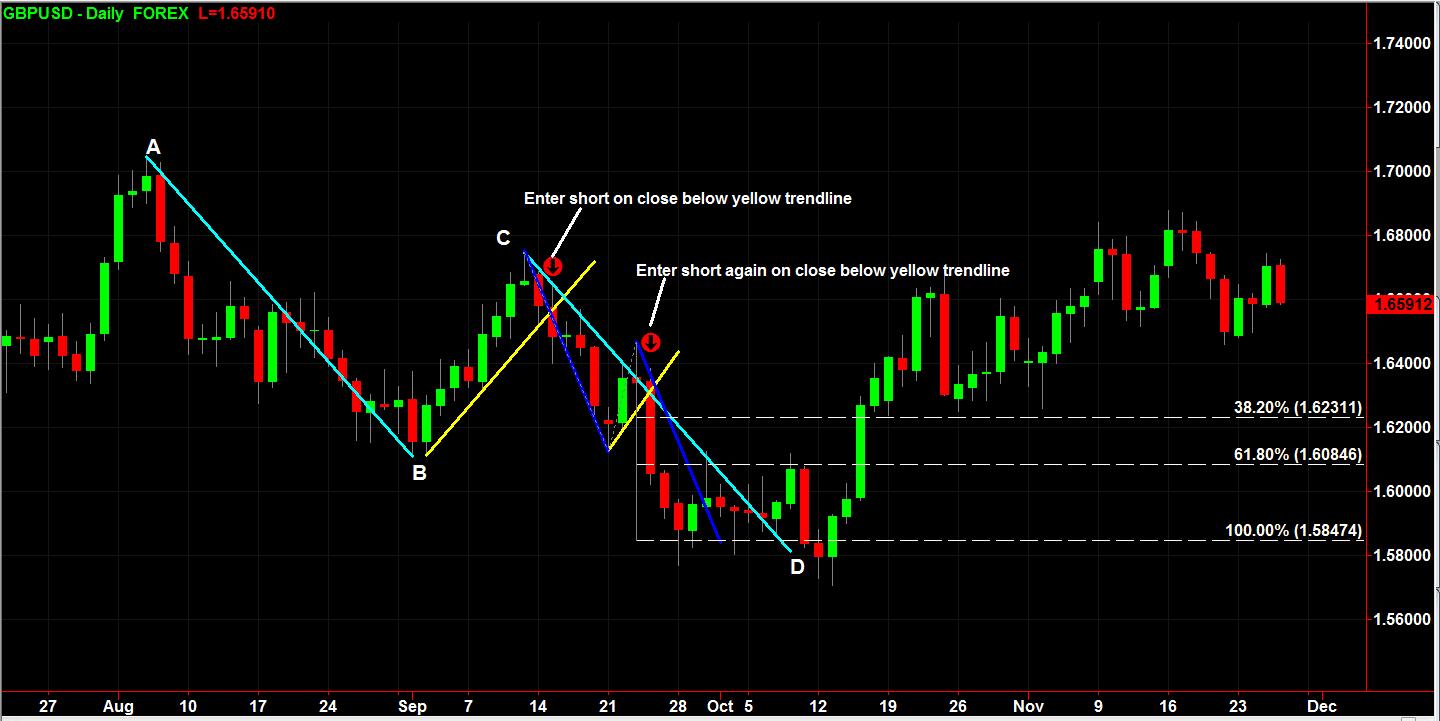
In the first chart, I entered short at the first red arrow and exited at either the .382 or.618 level. Shortly after exiting at these levels, there was another retracement! I can draw another trendline (2nd chart) wait for a new entry into the market, and measure where I will exit again at the .318 or .618 extensions of the last move.
Although I have now graduated to a newer, automated and more profitable method of trading, this method I just shared with you is valid in any market and any time frame! Try it on your own charts (hopefully MarketClub) and see for yourself.
Lawrence Korbus
Chief Forex Educator and Professional Trader
For more information about me and how I trade professionally, check out the Tsunami page.
Hi Lawrence,
Lets say you enter at the break of the retracement trendline. What would be your initial stop be?
I don't understand why he drew another fib projection from the second red arrow. In theory, this makes for an infinite number of possible retracements. Some people just can't mark up their charts enough!
Yes, I realize author was pointing out bigger moves and worth studying
Thanks for article and ideas.
Any time any "professional trader" uses the term "predict," run the other way. A ton of us use Elliott and Fibo. The key is we're projecting and guessing, according to past patterns, not predicting. Using the word "predict," should sell more product for this dude, than would using the more accurate terms of "project" or "educated guess." JMO
I concur. I've also read a lot of "bad stuff" about tsunami-trade. Why don't we just stick to Adam"s triangles and MarketClub!
Any negative reviews regarding Tsunami were in reference to a completely unrelated trading system the company marketed over 3 yrs ago. My understanding is many of the comments were made by a competitor who had a personal vendetta against an old employee of the company. The employee referenced left the company years ago, and to my knowledge, the competitor himself has long since disappeared. This occurred well before I joined Tsunami as a member in early 2008.
What I can tell you is that I derive my income using the Tsunami Trading software with my own personal trading account. I am having so much success with the new software that I agreed to become an educator for Tsunami Trading. The independent review published in the February 2009 issue of Stocks and Commodities magazine pretty much says it all about the current system. Please take the time to read it.
http://www.tsunami-trade.com/Library/StocksandCommoditiesFeb2009.pdf
or you can watch the live trade off Tsunami had against an acclaimed hedge fund manager at the 2009 Los Angeles TradersExpo on June 17, 2009 and see for yourself.
http://www.moneyshow.com/video/details.asp?wkspid=80BAC4F4A99647C09FDC1043C5152DCB1
Again, I personally use the software in my own trading and highly recommend it.
All good points made here if only it were a perfect world on our trading charts,
Sorry, but I have read a lot of negative reviews regarding Tsunami-Trade.
I've seen this time and again on several time frames by umpteen names.
Mostly it starts with the initial move as point "A", then to the bottom as point "B"
Next draw fib.
Look for retracement at 'marked' lines.<--point "C"
Followed by reverse move<--point "D"
Good on 5min for scalps, etc.
Don't see why it wouldn't work on longer time frames.
(Yes, I realize author was pointing out bigger moves and worth studying)
Thanks for article and ideas
ok ato b
why can it not go down to d?
and then to c?
u presume one leg up second down
why not both up?