

At MarketClub our mission is to help you become a better trader. Our passion is creating superior trading tools to help you achieve your goals -- no matter which way the markets move -- with objective and unbiased recommendations not available from brokers.
The Trader's Toolbox posts are just another free resource from MarketClub.
---
"MarketClub is known for our “Trade Triangle” technology. However, if you have used other technical analysis indicators previously, you can use a combination of the studies and other techniques in conjunction with the “Trade Triangles” to further confirm trends.
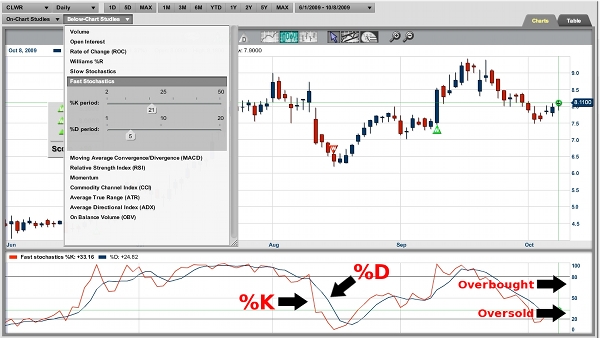
The stochastics indicator created by George Lane measures the relative position of the closing price within a given time interval. This indicator is based upon the premise that prices tend to close near the upper portion of a trading range during uptrends and near the lower portion of a trading range during downtrends. When prices close in the middle of a range, this suggests a sideways market. There are two components to this calculation, the %K value and the %D value. The %K is calculated as follows: %K= (C-Ln / Hn – Ln) x 100 where C = closing price of current period, Ln = lowest low during n time periods. Hn = highest high during n time periods and n = number of periods.
The %D value is the moving average of the %K value. The simple moving average calculation is: %D = 100 (Hn / Ln) also in the %K formula..."
Revisit the Trader's Toolbox Post: "Stochastics" here.
Hi Robin,
This article mentions two different kinds of oscillating indicators. These types of indicators use horizontal bands to determine if an asset is oversold/overbought (oversold meaning a market has fallen below its true value and overbought meaning the market has been pushed unreasonably high) in a non-trending market.
It’s not as important to know what formulas make up these indicators as it is to know what you’re looking at when you use them as Lindsay points out in the post above.
If you have more questions, feel free to contact our customer support team at 1-800-538-7424.
Best wishes in the New Year,
Susan Jackson
Webinar Administrator
INO.com & MarketClub
I am a beginning trader so I need some more info. What is a scholastic, what does it mean to me? Don't understand how to set it up or what slow fast and full scholastic speeds mean. The formula's you mention are gibberish to me, have no idea what the formulas are supposed to mean?
Iho,
I you are referring to your last question regarding the DOW, the market never closed below the level we referenced in the video.
I still think we are in the silly season when it comes to the market and I am sure there a lot of portfolio managers that would like to see the Dow, NASDAQ and the S&P 500 close at their best levels for the quarter.
When all the players return in mid-January this should be an interesting market to look at.
All the best,
Adam
Hi Adam,
Thank you for your feedback, but would you be so kind to specify how crossed swing should be considered?-by closing market below lowest body in that previous swing or below its shadow? On your video you considered bottom of candle's body.
Looking forward.(this my l question before Christmas)
Regards,
Iho
I use full stochastics on e-signal with a setting of 14-3-3 on 1 minute chart. A 21-3-3 on 3 minute chart and a 28-3-3 on a 5 minute chart. This cuts down on the whipiness of the signal. Hope this helps. Merry Christmas all.
Radheshyam,
Thank you for feedback.
You can learn all about Trade Triangles at http//marketclub.com.
All the best,
Adam
I will be obliged with your reply on WHAT IS TRADE TRIANGLE
What should be the setting/parameters of Stochastics for trading e-mini s&p500 in the NinjaTrader platform?
Kamal,
I'm not familiar with the ninja trader platform so it could not respond to your question in a responsible way.
Adam
Which of the Stochastics should we use,Fast, Slow or Full?
What periods work best?
Stan,
Thank you for your feedback.
This all gets back to what kind of trader you are. Some traders use the slow stochastic for trend and the shorter faster stochastic timing.
I hope this helps.
Adam
Hi Adam,
I have a question for you regarding your last video posted of DJI chart where you admitted if new price closes below previous low which was 10,285.97 ,market might go down. But on this chart we clearly see that this low 10,285.97 is already closed lower then previous low was closed on Nov 28th.or 29th. but market moved up. The question here is maybe it would be more safer if this breakthrough-closing candle will be below lowest shadow in this side-wise trend?
Please give an advise.
Looking forward and Mary Christmas to you.
Yours sincerely,
Iho
Iho,
Thank you for your feedback.
The DOW did not close below the level we mentioned in the video of 10,285.97. The problem for the end of the year is that the markets are always very thinly traded and can be moved around on very small volume.
I think we're going to have to wait till 2010 to get a better idea of what the real markets doing when traders come back from their vacations.
Merry Christmas to you.
Adam
As a beginning trader learning about all the indicators was fun and revealing. Stochastics was one of my favorites. However, I've become so used to looking at price action and it's interaction with key areas on multiple timeframe charts that I feel that oscillator-oriented tools used in rotational phases of the market does not provide me with the same kind of information needed. I feel that the infomation and timing that is extracted from Stochastics by the trader is so far removed from how price is moves in the market. I think that depending too heavily on oscillators can dampen the trader's ability to effectively interpret the order flow within various market types.
I still think it's a good timing tool that can aid in one's ability to use it to time trade entries and exits, as long as the trader knows how to use it in various market day types.
Thanks for poting the article
Johnny Stellon
I've just begun to investigate the "trade triangle" strategy and so far I'm quite impressed.
Investors should pay attention not only to fundamentals, but also to key technical indicators, such as the Stochastics you mention here. Yet, despite the various technical indicators, investors should pay attention to volume... it's one of the few leading indicators available.
What is the correct setting for the slow stochastics? Thks
Barb,
In MarketClub all of the key technical indicators are set as per the author of that study recommends. For example the slow stochastic's setting is as follows: %K 5, %D 5 and slow %D period 3.
Hope this helps.
Adam
Has anyone thought of trading the Markets with just Upper Indicators?
As Alan shows us the Weekly timeframe gives signals at different times than the Daily etc. so, it is with all the Lower Indicators. What we are trying to do is paint a picture on the chart that does not have to be interpreted and just trade it. Right?
Any suggestions on what values to use?
I notice this chart is 21 and 5.
Should we use fast, slow or full stochastics?
Stan,
See me response to Barb below.
Adam