
Ok, “best” is subjective. But this is my favorite swing trading strategy, mainly because it captures some explosive stock trades. There is a common price pattern that tends to occur before many stocks rally sharply. This pattern can be used as a strategy because it provides:
-
• A defined entry point.
• A stop loss that can often be placed within several percent of the entry point, keeping risk on the trade small.
• A favorable reward-to-risk opportunity, in that we only take trades where the likely profit is much bigger than our risk.
In this article, I will lay out how this all works, what the pattern is, how to trade it, and how to find it.
I have also noticed that the Trade Triangles can be used in conjunction with this strategy, providing alternative entry points and signaling when to take profit off the table. Therefore, you can continue to use the MarketClub Trade Triangles, or you can add them to the strategy to aid with your trade selection.
The Best Price Action Strategy For Stocks
My favorite price action strategy for stocks is what I call a contraction pattern.
The price must be in a strong uptrend, and then it experiences at least two declines, with the latter decline being smaller than the first. This shows that selling momentum is declining. However, that’s a good thing because we are waiting for an opportunity to buy this stock when it shows signs it is starting to move back to the upside.
Ideally, the price moves back to near the high of the uptrend after each of the two (or more) declines.
Therefore, the pattern consists of at least two declines, with the latter smaller than the first. After each decline, the price rallies back to near the highs. Once the price has had at least two drops and has moved back to high, I wait for the price to move sideways in a small range for a few days. This is called a consolidation.
I then wait for the price to move above the high point of the small range/consolidation, and that is when I buy.
The pattern will often look like an ascending or symmetric triangle.
Here is an example. Ballard Power Systems (BLDP) had already started to rise, and then this pattern occurs: The price falls in late November, rallies back to near the highs. Then falls again in early December. But this time, the decline is a bit smaller. Then it rallies back to the highs, pauses for two days, and then breaks higher.
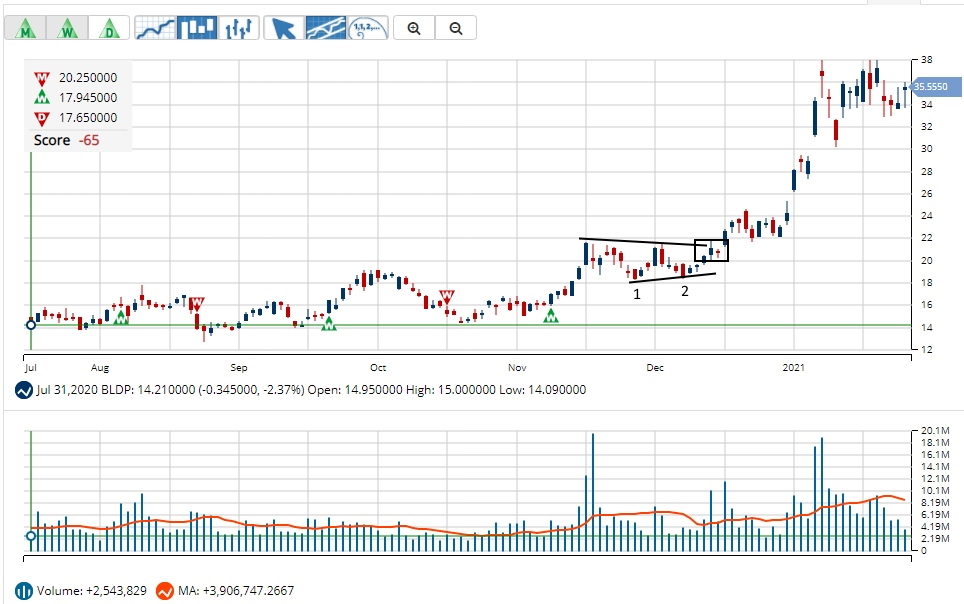
The Trade Triangles are also confirming the trade. At that point in time, the Monthly was pointed Up, and the Weekly was also pointed Up (shown on chart). I have also labeled the two drops, with the second being smaller than the first. After each drop, the price returns to near the high price.
A person could then watch for my entry signal, which is really above a consolidation near the highs (when the price moves above the small box I have drawn near $22), OR, they could enter a long position when a Daily Up Trade Triangle occurs. For example, the INO Trade Triangles provided entries near $20 and $22.
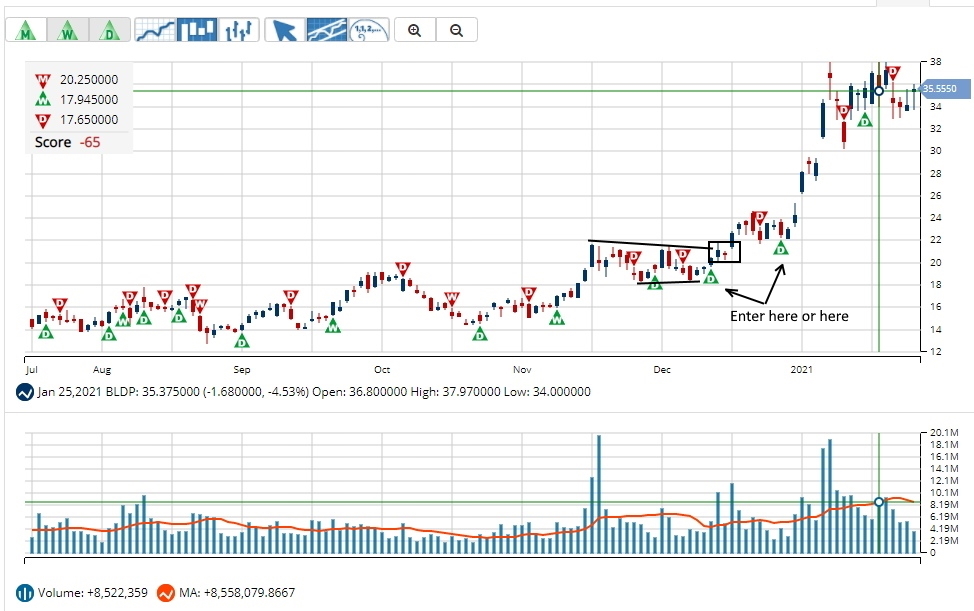
Thus, we wait for the pattern to form. If using the INO Trade Triangles, the Weekly and Monthly should be pointed up. Then wait for a daily signal after the price action pattern has formed. I would only be interested in the Daily Trade Triangle entries near the pattern since I know that this pattern often produces strong upward price moves if the price can break higher from it.
Setting the Stop Loss On The Price Action Strategy
I prefer to keep my risk as small as possible, even if it means being stopped out and sometimes having to re-enter a trade. That is my personal choice. Of course, you could choose to give the trades a bit more if you wish.
I place my stop loss order below the consolidation low. So on this trade, I am entering near $22 and placing a stop loss below the box I have drawn (first chart) near $20.
If you prefer to give your trades more room, maybe because you can’t watch them all the time, then you could place your stop loss below the most recent swing low. In this case, that would be just above $18, near the bottom of the contraction pattern.
In either case, the risk is limited to about $2 per share or about $4 per share in the latter case.
Determining A Profit Target Or Using Trade Triangles For An Exit
We not only want to consider when we will get out of a losing trade but also when we will get out of a winner.
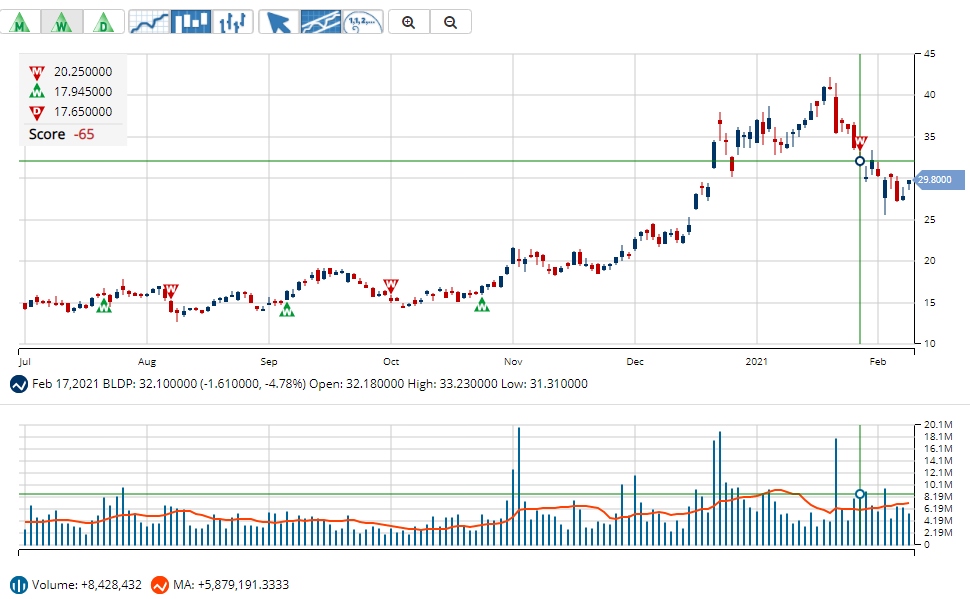
One of the simplest exit methods is to stay in the trade until the Weekly INO Trade Triangle turns Down. This exit signal occurred about two months after the entry. The Trade Triangle captured a big chunk of the move, signalling to exit near $32. More than a 50% gain from the $20 entry area.
Alternatively, place a profit target at 3x (or more) the stop loss distance from the entry price.
If you enter near $22, with a stop loss near $20 ($2 risk), then place a target at least $6 above $22. If the price hits $28, you will have made three times as much as you were risking.
This is one of the “pro secrets” of why I prefer to keep my risk small. Because then the price doesn’t have to move very far to give me a very favorable reward: risk ratio.
If I enter at $22 and place a stop loss at $18, my risk is now $4 per share. The price must move up $12 to $34 to give me a return that is 3x my risk. In this case, the price did move that high, but the bigger the stop loss, the higher the price will need to go to compensate for that risk. Statistically, a really big price jump has a smaller chance of occurring than a smaller price jump.
The first trade (smaller risk) is more efficient to me because:
-
• I am still making 3x the amount risked.
• Making more on my winners means I can lose lots of trades and still make money because the amount lost is so much smaller than the amount made on winners.
• The price doesn’t have to move very far to reach that target (compared to a bigger stop loss and thus a bigger target).
• The smaller the stop loss and target, the less time I am in that trade (and can then move onto another opportunity).
• Small risk trades allow me to put bigger amounts of capital into the trade. If the risk is larger, then I put less capital. For example, I will put half as much capital in a trade that has 10% risk compared to a trade with 5% risk.
So that is just me. I prefer to keep my risk small. Determine how you will set your stop loss and how you will exit profitable trades, and then stick with. Over many trades, you can then compare if one method works better for you than another.
Finding Trades (Scanning)
If you use the Market Club Trade Triangles, then you could scan for this pattern by looking for stocks that are in uptrends based on the Monthly and Weekly trends. Then look for stocks that triggered on the Daily Triangles within the last day or two signal potential trades.
Within Market Club > Trade Triangles > Equity > Volume Greater than 500,000 (or 100,000) > Daily Trade Triangles > Search Since Yesterday > Scan
This will produce a list of stocks. Sort by “Score” so the highest scores show up at the top. These will be the stocks with the Monthly, Weekly, and Daily Triangles all pointed up.
Click on the chart icon to see if the stock has formed a contraction pattern.
Alternatively, run a scan for stocks that are performing well on a scanner like StockRover or Finviz. Then skim over the charts to see which stocks are forming the contraction pattern and may be close to a trade setup.
Which Price Action Swing Trades To Take
There is only so much capital in an account, so trading is all about selection and trying to pick the best stocks at any given time.
-
• I prefer stocks that are stronger over weaker (have moved up a higher percentage).
• I prefer stocks that moved nearly vertically into the contraction pattern (as opposed to moving choppily higher).
• I prefer contractions that have formed over a month or longer. Tiny contraction patterns aren’t of interest to me.
• I prefer stocks that got back to near the highs (shows strength) after each decline (compared to stocks that keep dropping and not recovering).
• I prefer contractions that look relatively small compared to recent price action as opposed to being huge (covers a 20% price area versus covering a 50% price area). Large percentage drops (bigger than what we have seen during the rally) are more indicative of a market top as opposed to a rally higher.
• I prefer not to hold a trade through Earnings.
These guidelines help me determine which trades to take. For example, say I have three potential trades, I will usually only take a trade in the best one of the three (based on the parameters above). On the other hand, if none of the potential trades fit what a really good setup should look like, then I wait for a contraction swing trade that ranks high on all the above parameters.
More Examples Of The Price Action Swing Trading Strategy In Action
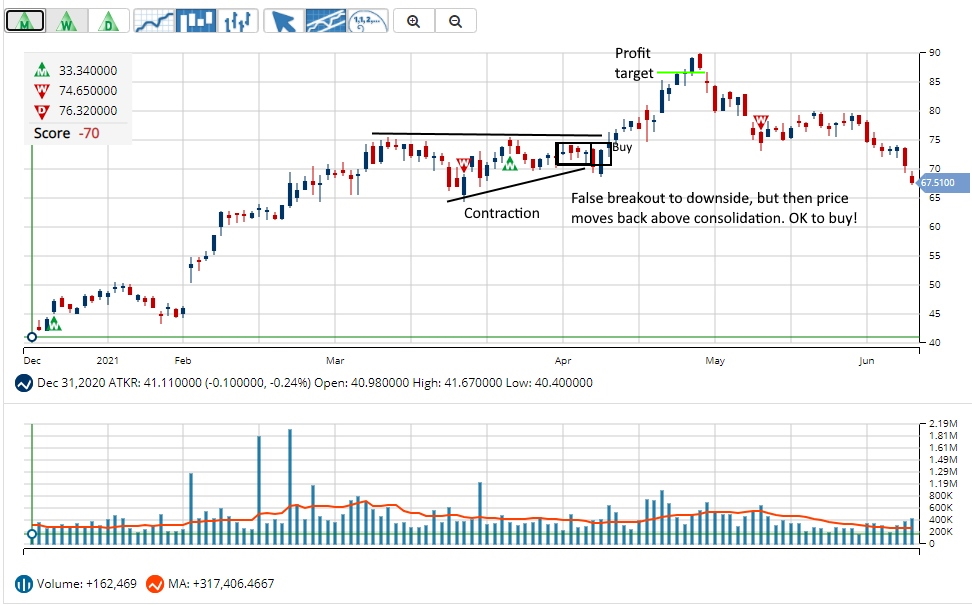
Atkore Inc. (ATKR) had a really strong uptrend, and then a contraction pattern occurred. Monthly and Weekly Trade Triangles were pointed higher by the time the contraction pattern fully formed. Two drops occurred (last smaller than first), and then the price rallied and consolidated near the highs. This time, the price dropped below the consolidation before rallying back above. That’s ok! Still use the consolidation high for the entry point, and you can use the original consolidation low for a stop loss.
Entering near the top of the consolidate provided an entry near $74.80. My stop loss would go at $70.50, for $4.30 in risk per share. Multiply that by 3 for a target of $87.70. This was hit as the price moved up to $90.
Daily Trade Triangles signaled entries at $71.90 and $74.60 (not shown to keep the chart clean). The Weekly Trade Triangle exit signaled an exit near $74.40 (shown).
Play around with the pattern, look for it, and develop your own strategy around it. Of course, it doesn’t occur before every big rally, but a contraction pattern like this does occur before many of them.
By Cory Mitchell, CMT
TradeThatSwing.com
About the author: Cory Mitchell is a Charted Market Technician (CMT) and has been making his living off the markets since 2005. He focuses on day trading and swing trading stocks and currencies. He is the founder of TradeThatSwing.com and the author of the EURUSD Day Trading Course and the Complete Method Stock Swing Trading Course.
anyone who uses Stop/Loss is gonna LOSE every time !! Never used it .. Never will.
Interesting concept on the price action swing trading strategy. However, the chart examples seem to always illustrate a strategy based on the stocks past price movements. This tends to irritate me since its not the past price actions we need to base this strategy off of, its the current price actions we are attempting to strategize and forecast the future price movement. How does this strategy attempt to forecast the more forward moving prices? Great concept though. If I can get a better grasp on it I would like to be able to use it as an alternative strategy to one I currently use when I enter into options positions.
Thanks
Kris
The pattern is based on past price action, but is used to help forecast what will come next. Once the contraction occurs, then start looking for a valid entry, as discussed, as another upswing could develop from there.
TPX (Tempur Sealy) is a great recent example: contraction, consolidation, then a breakout of the consolidation. Those were the signs to get in, before the big pop occurred (on July 1, 2021)
AB forming a similar pattern.
EXTR also. We'll see if that works out since it triggered an entry but then pulled right back (there will be losses with any strategy)
SLM another
The pattern tends to occur BEFORE a big move. That is its forecasting power. Then I want to see very specific things occur so I can keep my risk small relative to my potential reward.
Each Wednesday (after hours) there is an updated stock watchlist for this strategy.
This one was published on June 30. Some really nice-looking setups.
US and Canadian Swing Trading Watchlist and Market Outlook – June 30 edition
https://tradethatswing.com/us-and-canadian-swing-trading-watchlist-and-market-outlook-june-30-edition/