
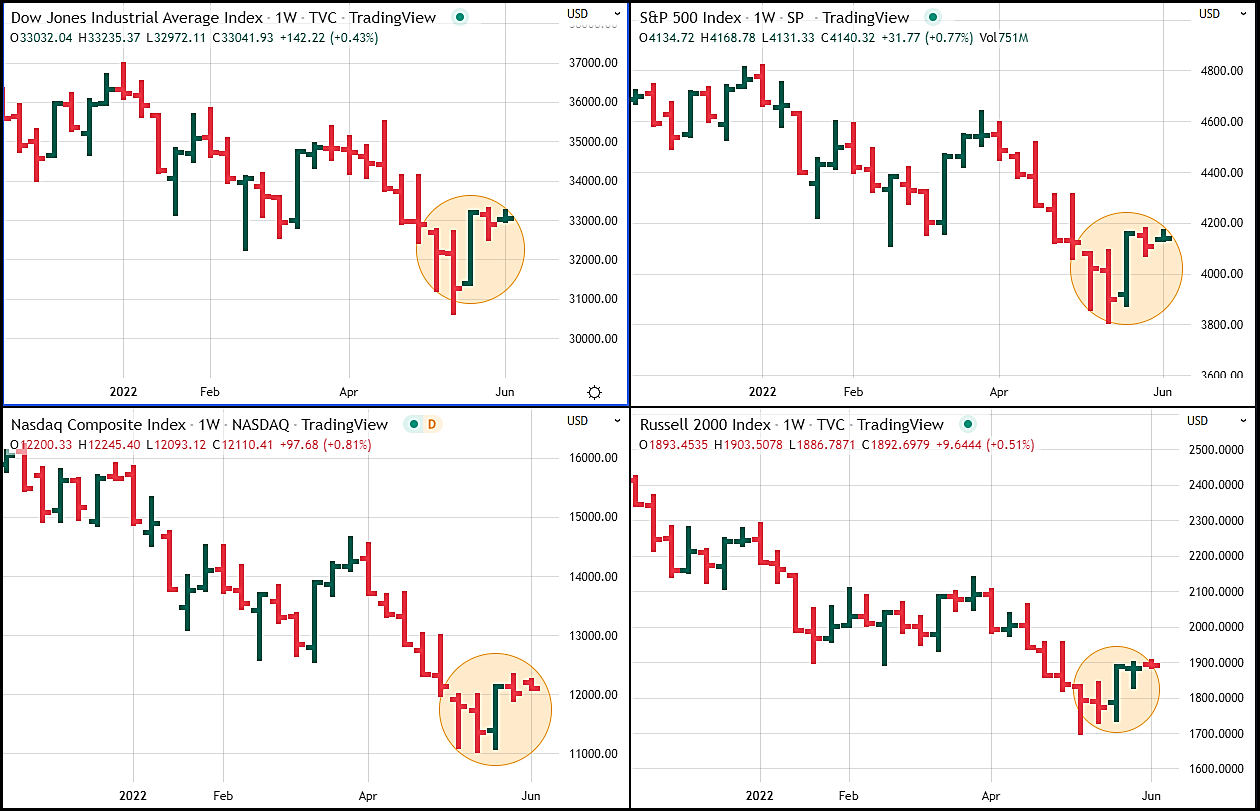
In last week’s installment, I told you about how we finally got a solid weekly up bar across every major stock index. In fact, I went into detail about the 6% plus bullish action for the Dow, the S&P 500, the Nasdaq, and even the broad market Russell 2000.
In addition, across the board, they all reversed multi-week down bars. And the Dow’s reversal was the most longed-for of all four indexes: It snapped an eight-week collection of weekly down bars.
All in all, the action was a welcome sigh of relief. So, what happened after that? Did we get much follow-through last week?
While we didn’t get another weekly up bar in all four indexes, all four did manage to book higher lows than the prior week.
Is that a good thing? You bet. It means that despite selling, prices held up. It also means that sellers didn’t have to resort to continually lower lows to attract buyers: Buyers were finally willing to pay up for shares. And I don’t have to tell you that change in sentiment was a huge improvement over the constant bearish price action over the last two months.
Are we out of the woods yet? Not by a long shot. In fact, as I mentioned last week, the recent positive action in all four stock markets could just be a temporary bull market rally.
It might also develop into what’s called a “dead cat bounce.” Here’s what I mean:
A dead cat bounce is a temporary reversal in a downtrend. It looks like the downtrend may be changing course to the upside, but then it quickly resumes the downtrend. The ghoulish name comes from idea that even a dead cat will bounce up if it falls far enough and fast enough.
A dead cat bounce is also considered a “continuation pattern” in technical analysis jargon. That’s simply a fancy way of saying that the pattern – or trend – that was in place before the dead cat bounce is still alive and well following the “bounce.” In other words, continuing to the downside.
On a weekly basis, we can’t yet call the recent up week a dead cat bounce. And that’s because the continuation pattern to the downside has not yet been confirmed. For that to happen, we would have to take out the lows that were booked during that up week. And you can see from the below chart that we’ve not yet booked that confirmation.
Will that confirmation be in the offing down the road? No one knows for sure. But the fact that we failed last week to succumb to a huge amount of bearish action and that all four stock markets hung in there in certainly a step in the right direction.
Bitcoin Forms Solid Support At $28K
As I told you last week, Bitcoin (BTC) is getting the royal treatment as a risk-on asset. That’s why it is getting sold right along with other risky assets.
But not all BTC price action news is lousy. In fact, while we’ve focused on what has been happening in the stock market, BTC has been putting together some interesting technical features.
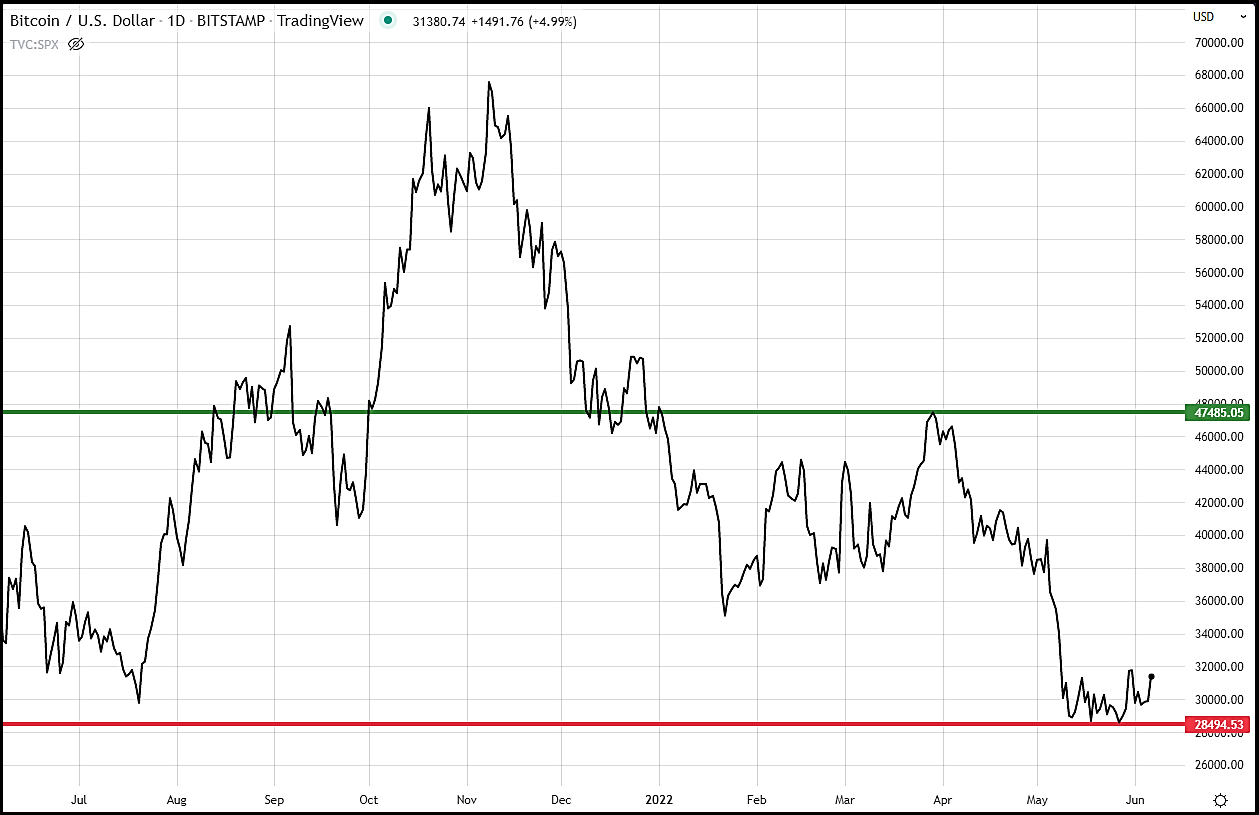
As you can see from this daily chart of BTC, the flagship cryptocurrency has pulled together some decent trading days since early May. In fact, there’s been such consistent buying in the $28K area that it’s formed a solid floor of support, the red line on the above chart.
And that’s important for a few reasons. The first is that it means that BTC has discovered a price level where sellers aren’t willing to go below. Simultaneously, BTC has discovered a price level buyers aren’t willing to go above. Together, that means a floor of support is in play.
The second reason that the $28K support level for BTC is important is because it’s in the range of a prior support level established in July 2021. Back then, the support was a bit higher, around $30K. While that’s not precisely the same level, in technical analysis, it’s acceptable and viewed as equivalent. As a result, that level in the $28K to $30K range has now held for two times over the past year, another bullish factor.
The last reason that the $28K support level for BTC is important is because it provides a jump-off point for more upside action. While sellers are willing to sell and buyers willing to buy at that level, if the appetite for BTC increases, prices will have nowhere to go but up.
That’s where the green line in the above chart comes into play. Right now, you can make the case that BTC has a clear shot at $48K to the upside without many stopping points on the way. While it’s had some trouble getting above that level over the past year, there’s no getting around that level would be a welcomed advance.
Wayne Burritt
INO.com Contributor
Disclosure: This contributor may own cryptocurrencies, stocks, or other assets mentioned in this article. This article is the opinion of the contributor themselves. The above is a matter of opinion provided for general information purposes only and is not intended as investment advice. This contributor is not receiving compensation (other than from INO.com) for their opinion.