
Despite inflation moderating slightly for October, the Fed doesn’t seem to be in the mood to pause the interest rate hike just yet. The continued rate hikes might bring further pain for businesses showing signs of a slowdown, with the cut in earnings estimates.
Since the market volatility is unlikely to catch a break anytime soon, shares of fundamentally strong, consumption-driven businesses, with demand and margins immune to an economic slowdown, seem ideal investments for potential upsides while ensuring adequate downside protection.
Hence, it would be opportune to add BJ's Wholesale Club Holdings, Inc. (BJ), Casey's General Stores, Inc. (CASY), and Lifeway Foods, Inc. (LWAY) as some technical indicators point to sustained upsides in them amid prevailing uncertainties.
BJ's Wholesale Club Holdings, Inc. (BJ)
BJ operates majorly on the east coast of the United States as a warehouse club operator. The company offers a curated assortment of perishables and other grocery products, general merchandise, gasoline, and other ancillary services.
Over the last three years, BJ’s revenues grew at an 11.6% CAGR, while its EBITDA grew at an 18.7% CAGR. The company’s net income grew at a 32.6% CAGR during the same period.
For the fiscal 2022 second quarter, ended July 30, 2022, BJ’s revenue increased 22.2% year-over-year to $5.10 billion, driven primarily by higher gasoline sales. During the same period, the company’s income from continuing operations and adjusted EBITDA increased 27% and 24.3% year-over-year to $141.01 million and $273.7 million, respectively.
BJ’s adjusted net income for the quarter came in at $144.30 million or $1.06 per share, up 27.3% and 29.3% year-over-year, respectively.
Analysts expect BJ’s revenue and EPS for the fiscal year ending January 2023 to increase 14.8% and 11% year-over-year to $19.13 billion and $3.61, respectively. Both metrics are expected to keep growing over the next two fiscals. Moreover, the company has impressed by surpassing consensus EPS estimates in each of the trailing four fiscals.
Owing to its strong performance and solid growth prospects, BJ is currently commanding a premium valuation compared to its peers. In terms of forward P/E, BJ is currently trading at 21.75x compared to the industry average of 18.98x. Also, its forward EV/EBITDA multiple of 14.07 compares to the industry average of 11.63.
BJ’s stock is currently trading above its 50-day and 200-day moving averages of $75.09 and $67.57, respectively, indicating a bullish trend. It has gained 10.4% over the past month and 19.3% year-to-date to close the last trading session at $78.36.
MarketClub’s Trade Triangles show that BJ’s long-term trend has been UP since July 22, 2022, while its intermediate-term trend has been UP since October 27, 2022. However, its short-term trend has been DOWN since November 11.
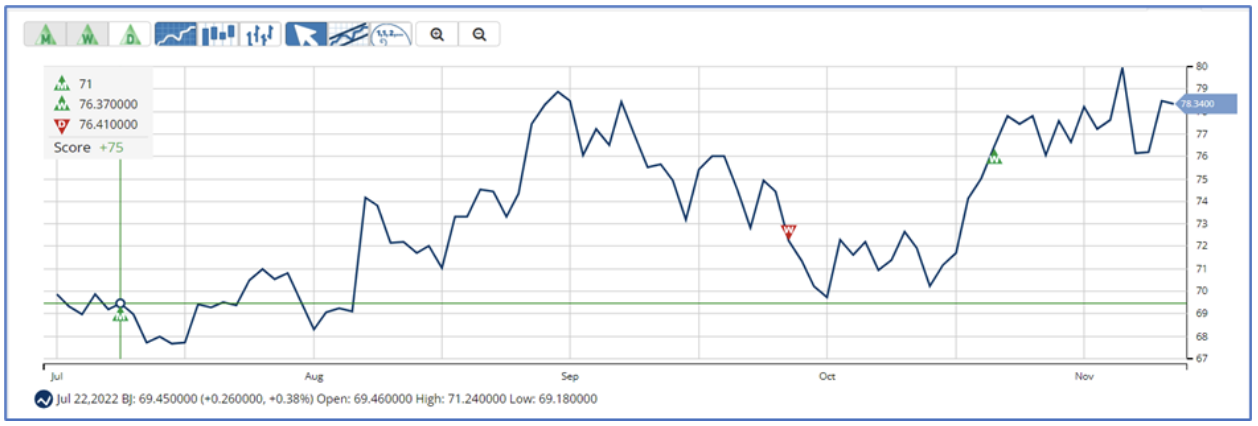
The Trade Triangles are our proprietary indicators, comprised of weighted factors that include (but are not necessarily limited to) price change, percentage change, moving averages, and new highs/lows. The Trade Triangles point in the direction of short-term, intermediate, and long-term trends, looking for periods of alignment and, therefore, strong swings in price.
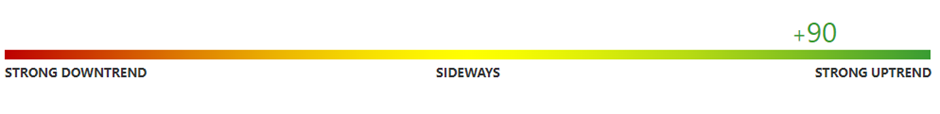
In terms of the Chart Analysis Score, another MarketClub proprietary tool, BJ scored +55 on a scale from -100 (strong downtrend) to +100 (strong uptrend), indicating that the stock cannot gain momentum in either direction.

The Chart Analysis Score measures trend strength and direction based on five different timing thresholds. This tool takes into account intraday price action, new daily, weekly, and monthly highs and lows, and moving averages.
Click here to see the latest Score and Signals for BJ.
Casey's General Stores, Inc. (CASY)
CASY operates convenience stores in the United under the Casey’s and Casey’s General Store names. It offers a selection of food, beverages, tobacco and nicotine products, health and beauty aids, automotive products, and other non-food items.
Over the last three years, CASY’s revenues grew at a 19.3% CAGR, while its EBITDA grew at a 13.7% CAGR. The company’s net income grew at a 19.4% CAGR during the same period.
For the first quarter of fiscal 2023 ended July 31, 2022, CASY’s total revenue increased 40% year-over-year to $4.46 billion due to strong inside sales driven by prepared food and dispensed beverages.
During the same period, CASY’s adjusted EBITDA grew 20.6% year-over-year to $293.21 million because of robust fuel margins as wholesale costs declined from record highs. The company’s quarterly net income increased 28.3% from the year-ago period to $152.93 million, up 28.2% year-over-year.
Analysts expect CASY’s revenue for the fiscal year 2023 to increase 22.6% year-over-year to $15.87 billion. The company’s EPS for the same period is expected to grow 10.6% year-over-year to $10.07. Moreover, the company has surpassed the consensus EPS estimates in three of the trailing four quarters.
In terms of forward P/E, CASY is currently trading at 23.48x compared to the industry average of 18.98x. Also, its forward EV/EBITDA multiple of 11.53 compares to the industry average of 11.63.
CASY’s stock is currently trading above its 50-day and 200-day moving averages of $215.81 and $202.84, respectively. It has gained 16.8% over the past month and 22% year-to-date to close the last trading session at $240.59.
MarketClub’s Trade Triangles show that CASY has been trending UP for all three-time horizons. The long-term trend for CASY has been UP since April 6, 2022. Its intermediate and short-term trends have been UP since October 18 and November 8, respectively.
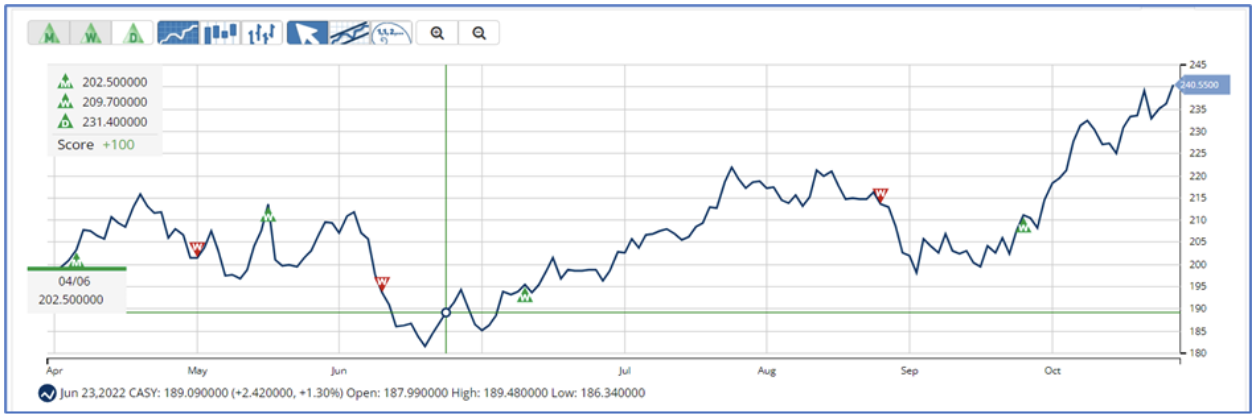
In terms of the Chart Analysis Score, another MarketClub proprietary tool, CASY scored +90 on a scale from -100 (strong downtrend) to +100 (strong uptrend), indicating that it is in a strong uptrend that is likely to continue. Traders should use caution and utilize a stop order.
Click here to see the latest Score and Signals for CASY.
Lifeway Foods, Inc. (LWAY)
LWAY is a global producer and marketer of probiotic products. The company primarily offers drinkable kefir, a cultured dairy product, in various organic and non-organic sizes. Other offerings include European-style soft cheeses, cream, and other products.
Over the last three years, LWAY’s revenue has grown at a 13.5% CAGR, while its EBITDA grew at a 70.7% CAGR.
For the third quarter of fiscal 2022, ended September 30, LWAY’s net sales increased 29.1% year-over-year to $38.14 million due to the company’s focus on the core Kefir business. During the same period, the company’s gross profit increased 8.5% year-over-year to $7.59 million.
LWAY’s net income for the quarter increased 104.8% year-over-year to $983 thousand, or $0.06 per share, up 100% year-over-year.
Analysts expect LWAY’s revenue and EPS for the fiscal ending December 2023 to increase 5% and 375% year-over-year to $152 million and $0.38.
In terms of the forward EV/Sales, LWAY is currently trading at 0.81, 52.9% lower than the industry average of 1.71. Also, its forward Price/Sales multiple of 0.67 compares to the industry average of 1.19.
Despite the attractive valuation, LWAY’s stock is trading above its 50-day and 200-day moving averages of $5.93 and $5.80, respectively, indicating a bullish trend. The stock has gained 34.8% over the past month and 48.7% year-to-date to close the last trading session at $7.21.
MarketClub’s Trade Triangles show that LWAY has been trending UP for all three-time horizons. The long-term trend for LWAY has been UP since August 12, 2022. Its intermediate and short-term trends have been UP since November 7 and October 28, 2022, respectively.
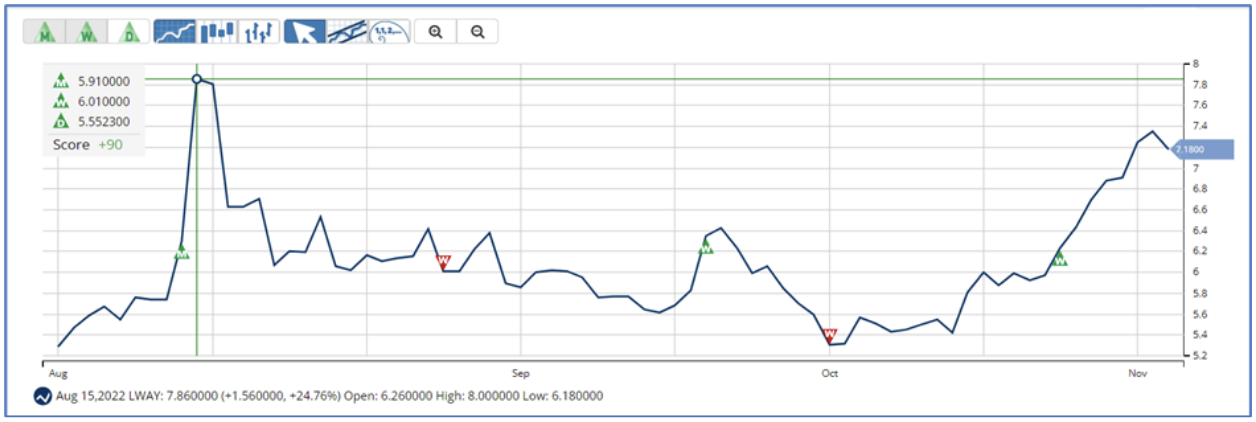
In terms of the Chart Analysis Score, another MarketClub proprietary tool, LWAY scored +100 on a scale from -100 (strong downtrend) to +100 (strong uptrend), indicating that the uptrend is likely to continue. Traders should protect gains and look for a change in score to suggest a slowdown in momentum.

Click here to see the latest Score and Signals for LWAY.
What's Next for These Consumer Stocks?
Remember, the markets move fast and things may quickly change for these stocks. Our MarketClub members have access to entry and exit signals so they'll know when the trend starts to reverse.
Join MarketClub now to see the latest signals and scores, get alerts, and read member-exclusive analysis for over 350K stocks, futures, ETFs, forex pairs and mutual funds.
Best,
The MarketClub Team
su*****@in*.com
I would like to consider your Market Club program. Please send information.