
High inflation has been a problem for the economy this year. Although the consumer price index (CPI) eased slightly in October, it remains way above the Fed’s 2% long-term target.
The Federal Reserve has been trying to combat runaway inflation by draining liquidity from the financial system by hiking the benchmark interest rates and selling off a significant part of its bond portfolio.
The Fed has raised the benchmark interest rate six times this year, with the fourth consecutive 75 basis point rate hike taking the target range to 3.75%-4%.
Bankrate’s chief financial analyst Greg McBride said, “A fourth consecutive rate hike of 0.75 percent – after going 28 years without one that large – speaks to the urgency of the Fed’s task.” “They’re still playing catch-up against inflation that continues to run near 40-year highs,” he added.
Concerns over rising borrowing costs have led to volatility in the stock market. However, not all sectors suffer from rising interest rates. Financial institutions, including banks, usually benefit from rising interest rates as it helps them expand their interest income.
Therefore, it could be wise to make the most of the strong uptrend in bank stocks JPMorgan Chase & Co. (JPM), Morgan Stanley (MS), and The Goldman Sachs Group, Inc. (GS).
JPMorgan Chase & Co. (JPM)
JPM is engaged in investment banking, financial services, and asset management. It operates in four segments, as well as a Corporate segment. The company’s segments are Consumer & Community Banking, Corporate & Investment Bank, Commercial Banking, and Asset Management.
Over the last three years, JPM’s revenue grew at a 3.9% CAGR, while its EPS grew at a 5.3% CAGR.
JPM’s total net revenue for the third quarter ended September 30, 2022, increased 10.3% year-over-year to $32.71 billion. The company’s net interest income increased 33.9% year-over-year to $17.51 billion. In addition, its net income increased 12.6% sequentially to $9.73 billion.
Analysts expect JPM’s revenue for the quarter ending December 31, 2022, to increase 15.9% year-over-year to $33.92 billion. Its EPS for the quarter ending March 31, 2023, is expected to increase 27.2% year-over-year to $3.35.
JPM’s stock is trading at a premium, indicating high expectations regarding the company’s performance in the upcoming quarters. In terms of forward non-GAAP P/E, JPM is trading at 11.49x, 9.5% higher than the industry average of 10.49x. Also, it is trading at a forward P/S multiple of 3.07, compared to the industry average of 2.90.
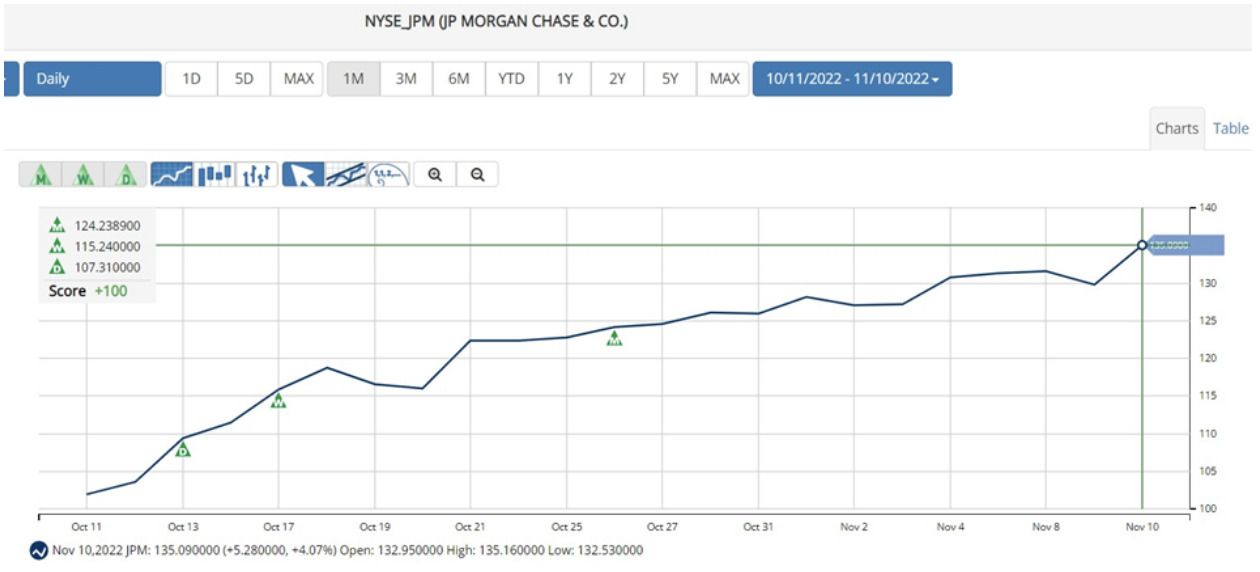
The stock is currently trading above its 50-day and 200-day moving averages of $116.73 and $124.72, respectively, indicating a bullish trend. It has gained 28.7% over the past month to close the last trading session at $135.08.
According to MarketClub’s Trade Triangles, JPM has been trending UP for all the three-time horizons. The long-term trend for JPM has been UP since October 26, 2022, while its intermediate-term and short-term trends have been UP since October 17, 2022, and October 13, 2022, respectively.
The Trade Triangles are our proprietary indicators, comprised of weighted factors that include (but are not necessarily limited to) price change, percentage change, moving averages, and new highs/lows. The Trade Triangles point in the direction of short-term, intermediate, and long-term trends, looking for periods of alignment and, therefore, intense swings in price.
In terms of the Chart Analysis Score, another MarketClub proprietary tool, JPM, scored +100 on a scale from -100 (strong downtrend) to +100 (strong uptrend), indicating that the uptrend will likely continue. Traders should protect gains and look for a change in score to suggest a slowdown in momentum.

The Chart Analysis Score measures trend strength and direction based on five different timing thresholds. This tool considers intraday price action; new daily, weekly, and monthly highs and lows; and moving averages.
Click here to see the latest Score and Signals for JPM.
Morgan Stanley (MS)
MS is a global financial services company that provides a range of investment banking, securities, wealth management, and investment management services. Its segments include Institutional Securities, Wealth Management, and Investment Management.
Over the last three years, MS grew its revenue at a 12.2% CAGR, while its net income grew at a 14.4% CAGR.
MS’ net revenues declined 12% year-over-year to $12.98 billion for the third quarter ended September 30, 2022.
Its interest income increased 160% year-over-year to $6.10 billion. The company’s total non-interest expenses declined 3% year-over-year to $9.56 billion. In addition, its net income applicable to Morgan Stanley increased 5% sequentially to $2.63 billion. Also, its adjusted EPS came in at $1.53, representing an increase of 6% sequentially.
For the quarter ending June 30, 2023, MS’ EPS and revenue are expected to increase 19.3% and 7.9% year-over-year to $1.83 and $14.17 billion, respectively. It surpassed Street EPS estimates in three of the trailing four quarters.
Due to its bright prospects, MS’ stock currently commands a premium valuation. In terms of non-GAAP P/E, MS is currently trading at 13.58x, 29.4% higher than the 10.49x industry average. Its non-GAAP PEG multiple of 4.53 is 298.6% higher than the 1.14 industry average. Also, it is trading at a forward P/B multiple of 1.63, compared to the industry average of 1.31.
MS’ stock is currently trading above its 50-day and 200-day moving averages of $82.79 and $85.45, respectively, indicating a bullish trend. It has gained 13.2% over the past month to close the last trading session at $88.80.
Trade Triangles show that MS has been trending UP for all three-time horizons. The long-term and intermediate-term trends for MS have been UP since August 10, 2022, and October 31, 2022, respectively. Its short-term trend has been UP since November 10, 2022.
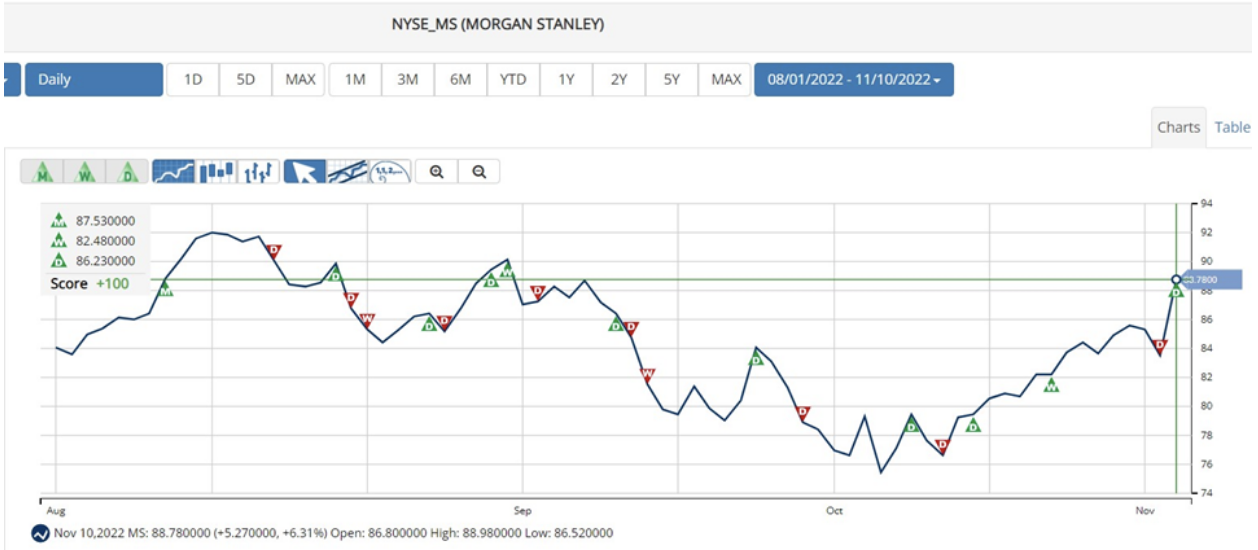
In terms of the Chart Analysis Score, MS scored +100 on a scale from -100 (strong downtrend) to +100 (strong uptrend), indicating that the uptrend will likely continue.
Click here to see the latest Score and Signals for MS.
The Goldman Sachs Group, Inc. (GS)
GS is a global financial institution that delivers a range of financial services across investment banking, securities, investment management, and consumer banking to a diversified client base that includes corporations, financial institutions, governments, and individuals. The company operates through four segments: Investment Banking, Global Markets, Asset Management, and Consumer & Wealth Management.
Over the last three years, GS grew its revenue at a 12% CAGR, while its net income grew at a 15.1% CAGR.
GS’ total net revenues declined 12% year-over-year to $11.97 billion for the third quarter ended September 30, 2022.
Its net interest income increased 30.6% year-over-year to $2.04 billion. The company’s cash and cash equivalents, ending balance for nine months ended September 30, 2022, increased 34.2% year-over-year to $284.25 billion.
Analysts expect GS’ EPS for the quarter ending June 30, 2023, to increase 14.7% year-over-year to $8.86. Its revenue for the quarter ending March 31, 2023, is expected to increase 2.9% year-over-year to $13.31 billion. It surpassed consensus EPS estimates in three of the trailing four quarters.
In terms of forward non-GAAP P/E, GS is trading at 11.08x, 5.6% higher than the industry average of 10.49x. On the other hand, it is trading at a forward P/S multiple of 2.77, compared to the industry average of 2.90. Also, its 1.22x forward P/B is 6.8% below its industry average of 1.31x.
The stock is currently trading above its 50-day and 200-day moving averages of $324.23 and $325.24, respectively, indicating a bullish trend. It has gained 25.9% over the past month to close the last trading session at $378.31.
According to Trade Triangles, GS has been trending UP for all the three-time horizons. The long-term trend for GS has been UP since August 3, 2022, while its intermediate-term and short-term trends have been UP since October 18, 2022, and October 14, 2022, respectively.
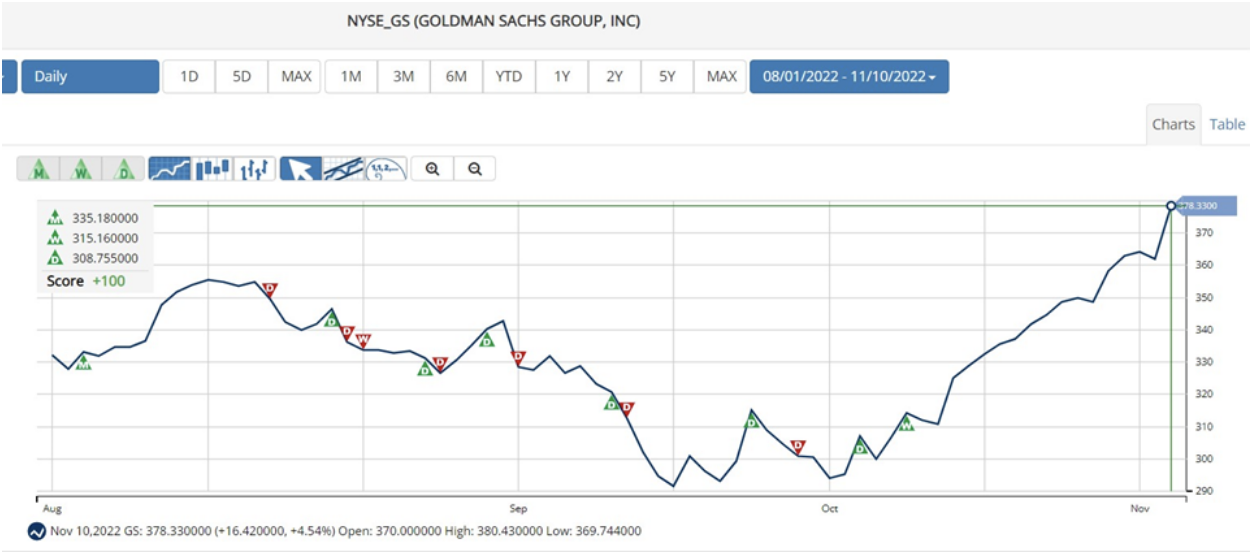
In terms of the Chart Analysis Score, GS scored +100 on a scale from -100 (strong downtrend) to +100 (strong uptrend), indicating that the uptrend will likely continue.
Click here to see the latest Score and Signals for GS.
What's Next for These Bank Stocks?
Remember, the markets move fast and things may quickly change for these stocks. Our MarketClub members have access to entry and exit signals so they'll know when the trend starts to reverse.
Join MarketClub now to see the latest signals and scores, get alerts, and read member-exclusive analysis for over 350K stocks, futures, ETFs, forex pairs and mutual funds.
Best,
The MarketClub Team
su*****@in*.com