
The world’s largest manufacturer of agricultural equipment, Deere & Company (DE), beat analysts’ EPS and revenue estimates for the fiscal fourth quarter that ended October 30, 2022, despite the uncertain macroeconomic environment, higher raw material prices, and supply chain challenges.
DE’s EPS came 9% above the consensus EPS estimate, while its revenue surpassed the analyst estimates by 6.6%. The company’s Production & Precision Agriculture segment sales rose 59% year-over-year to $7.43 billion. Its operating margins came in at 23.4%, compared to 16.7% in the prior-year period.
Small Agriculture & Turf segment saw similar growth. Net sales rose 26% year-over-year to $3.54 billion, and its operating margin came in at 14.3%, compared to 12.3% in the year-ago period.
Its Construction & Forestry segment’s net sales witnessed a 20% year-over-year increase to $3.37 billion, with its operating profit rising 53% year-over-year to $414 million.
The company’s Financial Services segment’s net income rose 2% year-over-year to $232 million. Despite the challenges, DE’s strong pricing power was on display, as price realization was positive by about 19 percentage points which helped offset a three-point headwind from a higher U.S. dollar.
During a conference call with analysts, DE’s manager of investor communications, Rachel Bach, said, “Across our businesses, performance was driven by continued strong demand, higher production rates, and progress on reducing our inventory in partially completed machines.”
The Moline, Illinois-based company has provided strong guidance for 2023 based on its strong pricing, higher infrastructure spending, and healthy industry outlook. For 2023, its net income expectation is between $8 billion to $8.50 billion, which is 5% higher than consensus estimates.
DE’s Chairman and CEO, John C. May, said, “Deere is looking forward to another strong year in 2023 based on positive farm fundamentals and fleet dynamics as well as an increased investment in infrastructure.”
DE has gained 28.6% in price year-to-date and 26.7% over the past year to close the last trading session at $440.97. Credit Suisse analyst Jamie Cook has reiterated an outperform rating on the stock and has raised the target price from $447 to $582.
Here’s what could influence DE’s performance in the upcoming months:
Robust Financials
DE’s total net sales and revenues increased 37.2% year-over-year to $15.53 billion for the fourth quarter. Net income attributable to DE increased 75.1% year-over-year to $2.24 billion. The company’s EPS came in at $7.44, representing an increase of 80.6% year-over-year.
Favorable Analyst Estimates
DE’s EPS for fiscal 2023 and 2024 is expected to increase 16% and 4% year-over-year to $27.81 and $28.91, respectively. Its revenue for fiscal 2023 and 2024 is expected to increase 12.1% and 2.6% year-over-year to $53.72 billion and $55.11 billion, respectively.
High Profitability
Regarding the trailing-12-month gross profit margin, DE’s 31.35% is 7.4% higher than the 29.20% industry average.
Likewise, its 19.45% trailing-12-month EBIT margin is 100.2% higher than the industry average of 9.72%. Furthermore, the stock’s 7.20% trailing-12-month Capex/Sales is 143.6% higher than the industry average of 2.96%.
Mixed Valuation
Regarding forward non-GAAP P/E, DE’s 15.86x is 5.7% lower than the 16.82x industry average. Likewise, its 1.16x forward non-GAAP PEG is 22.3% lower than the 1.49x industry average.
However, its 3.38x forward EV/Sales is 103.4% higher than the 1.66x industry average. Also, its 2.48x forward P/S is 92.7% higher than the 1.29x industry average.
Technical Indicators Show Promise
According to MarketClub’s Trade Triangles, the long-term trend for DE has been UP since October 26, 2022, and its intermediate-term trend has been UP since October 10, 2022. In addition, the stock’s short-term trend has been UP since November 18, 2022.
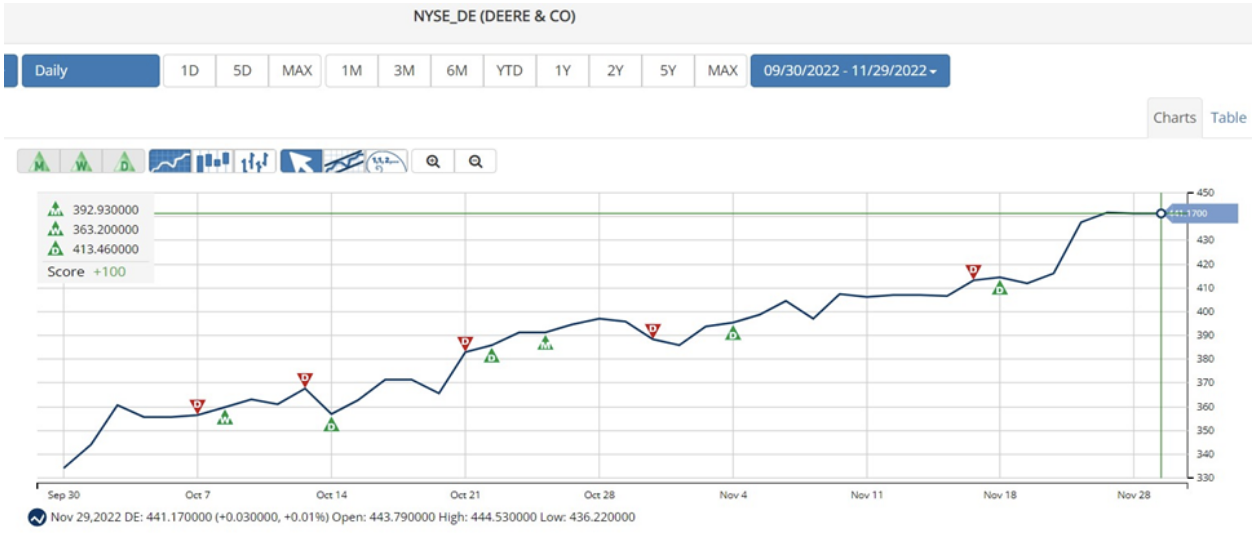
The Trade Triangles are our proprietary indicators, comprised of weighted factors that include (but are not necessarily limited to) price change, percentage change, moving averages, and new highs/lows. The Trade Triangles point in the direction of short-term, intermediate, and long-term trends, looking for periods of alignment and, therefore, intense swings in price.
In terms of the Chart Analysis Score, another MarketClub proprietary tool, DE scored +100 on a scale from -100 (strong downtrend) to +100 (strong uptrend), indicating that the strong uptrend is likely to continue. Traders should protect gains and look for a change in score to suggest a slowdown in momentum.

The Chart Analysis Score measures trend strength and direction based on five different timing thresholds. This tool considers intraday price action; new daily, weekly, and monthly highs and lows; and moving averages.
Click here to see the latest Score and Signals for DE.
What's Next for Deere & Company (DE)?
Remember, the markets move fast and things may quickly change for this stock. Our MarketClub members have access to entry and exit signals so they'll know when the trend starts to reverse.
Join MarketClub now to see the latest signals and scores, get alerts, and read member-exclusive analysis for over 350K stocks, futures, ETFs, forex pairs and mutual funds.
Best,
The MarketClub Team
su*****@in*.com
Good luck in 2023