
Personal finance fintech company SoFi Technologies, Inc. (SOFI) reported solid fourth-quarter results.
Its loss per share came below analyst estimates, and its revenue beat the consensus estimate by 4.1%. The company’s adjusted net revenue in the fourth quarter came in 4.2% above its guidance range high of $425 million, and its adjusted EBITDA came $23 million above the high-end of its guidance.
SOFI’s CEO Anthony Noto said, “Record revenue across all three of our business segments – Lending, Technology Platform, and Financial. Our continued strong growth and significant improvement in GAAP net income margin position us very well in 2023 for another year of significant revenue and EBITDA growth and for reaching GAAP net income profitability in the fourth quarter.”
SOFI’s solid results could be attributed to its total deposits, which rose 46% sequentially and more than 700% in 2022 to $7.34 billion. The company benefited from the Fed’s aggressive interest rate hikes leading to its rise in net interest income.
The company added 480K members in the fourth quarter. Its total members came in at 5.22 million, rising 51% year-over-year. It added 695K new products in the fourth quarter, bringing total products to 7.89 million in 2022, increasing 53% year-over-year.
Noto said, “Our strong momentum in member and product adds, and the momentum in products added from cross-buy, reflects the benefits of our broad product suite and Financial Services Productivity Loop (FSPL) strategy.”
“Total deposits at SoFi Bank grew 46% sequentially during the fourth quarter to $7.30 billion at year-end, and 88% of SoFi Money deposits are from direct deposit members. We continued to see nearly half of newly funded SoFi Money accounts set up direct deposit by day 30, and average spend in the fourth quarter rose 25% versus the third quarter. As a result of this growth in high-quality deposits, we are benefiting from a lower cost of funding for our loans,” he added.
For the first quarter of fiscal 2023, the company guided its adjusted net revenue between $430 million to $440 million.
In addition, it expects its adjusted EBITDA to come between $40 million to $45 million. In the fourth quarter of fiscal 2023, the company expects positive GAAP net income and a 20% incremental GAAP net income margin for the full year.
For fiscal 2023, SOFI expects its adjusted net revenue to be between $1.925 billion and $2 billion. Also, the company expects its adjusted EBITDA to come between $260 million to $280 million.
SOFI’s stock has gained 65.8% in price over the past month and 39.2% over the past three months to close the last trading session at $7.46.
Here’s what could influence SOFI’s performance in the upcoming months:
Mixed Financials
SOFI’s adjusted net revenue increased 58.4% year-over-year to $443.42 million for the fourth quarter ended December 31, 2022. The company’s adjusted EBITDA rose significantly from the prior-year quarter to $70.06 million.
Its net loss narrowed 64% year-over-year to $40 million. In addition, its loss per share narrowed 67% year-over-year to $0.05.
Mixed Analyst Estimates
Analysts expect SOFI’s EPS for fiscal 2023 to be negative. Its EPS is expected to be positive for fiscal 2024. Its revenue for fiscal 2023 and 2024 is expected to increase 27.5% and 24.1% year-over-year to $1.96 billion and $2.44 billion, respectively. It surpassed Street EPS estimates in each of the trailing four quarters.
Stretched Valuation
In terms of forward P/S, SOFI’s 3.55x is 35.2% higher than the 2.62x industry average. Likewise, its 1.36x forward P/B is 14.7% higher than the 1.19x industry average.
Mixed Profitability
SOFI’s trailing-12-month net income margin of negative 21.09% compares to the 27.51% industry average. Its trailing-12-month Return on Total Assets of negative 1.69% compares to the 1.19% industry average.
On the other hand, its 6.83% trailing-12-month Capex/Sales is 312.6% higher than the industry average of 1.66%. In addition, its 79.38% trailing-12-month gross profit margin is 27.5% higher than the industry average of 62.26% industry average.
Technical Indicators Show Promise
According to MarketClub’s Trade Triangles, the long-term and intermediate-term trends for SOFI have been UP since January 30, 2023, and January 9, 2023, respectively. Its short-term trend has been UP since December 29, 2022.
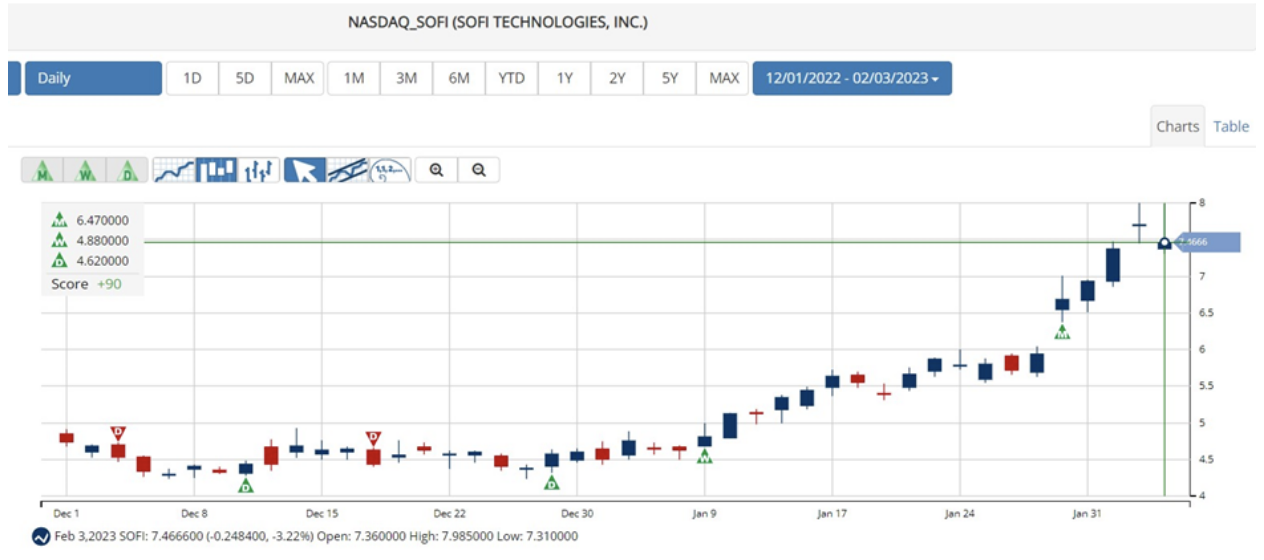
The Trade Triangles are our proprietary indicators, comprised of weighted factors that include (but are not necessarily limited to) price change, percentage change, moving averages, and new highs/lows. The Trade Triangles point in the direction of short-term, intermediate, and long-term trends, looking for periods of alignment and, therefore, intense swings in price.
In terms of the Chart Analysis Score, another MarketClub proprietary tool, SOFI, scored +90 on a scale from -100 (strong downtrend) to +100 (strong uptrend), indicating that the uptrend will likely continue. While SOFI shows signs of intraday weakness, it remains in the confines of a bullish trend. Traders should use caution and utilize a stop order.
The Chart Analysis Score measures trend strength and direction based on five different timing thresholds. This tool considers intraday price action; new daily, weekly, and monthly highs and lows; and moving averages.
Click here to see the latest Score and Signals for SOFI.
What's Next for SoFi Technologies, Inc. (SOFI)?
Remember, the markets move fast and things may quickly change for this stock. Our MarketClub members have access to entry and exit signals so they'll know when the trend starts to reverse.
Join MarketClub now to see the latest signals and scores, get alerts, and read member-exclusive analysis for over 350K stocks, futures, ETFs, forex pairs and mutual funds.
Best,
The MarketClub Team
su*****@in*.com