
After witnessing unprecedented growth during the pandemic, videogame publishers are witnessing a reversion to the mean with a reversal to pre-pandemic lifestyles amid macroeconomic uncertainties driven by inflation and increased borrowing costs due to interest-rate hikes.
However, despite the softened demand in the broader industry, incumbents, like Activision Blizzard, Inc (ATVI), have cornered pockets of growth with proven blockbusters such as Call of Duty, World of Warcraft, and Candy Crush commanding a greater share of gamers’ pinched pockets.
The gaming giant looks to merge with Microsoft Corporation (MSFT) this year. It reported record net bookings for the holiday quarter and 2022, exceeding analysts’ expectations.
With continued investment in growing its development teams, robust product pipeline, live game opportunity, and ongoing focus on operational discipline, ATVI seems on course for another year of outperformance.
ATVI has dipped marginally over the past month to close the last trading session at $76.25. The stock is trading above its 50-day moving average of $76.10 and almost at par with its 200-day moving average of $76.40, indicating an uptrend.
Here is what may help the stock maintain its performance in the near term.
Solid Track Record
Over the past three years, ATVI’s revenue has exhibited a 5.1% CAGR. While the company has increased its net income at a modest 0.2% CAGR, its total assets have grown at 11.3% CAGR over the same time horizon.
Robust Financials
Despite softer demand tied to the weaker macroeconomic environment, ATVI’s net bookings for the fourth quarter of the fiscal, which ended December 31, 2022, increased 43.4% year-over-year to a record $3.57 billion. The company’s total net revenues increased 7.9% year-over-year to $2.33 billion, while its non-GAAP EPS came in at $0.78 during the same period.
ATVI’s total assets came in at $27.38 billion as of December 31, 2022, compared to $25.06 billion as of December 31, 2021.
Favorable Analyst Estimates
As ATVI looks forward to a historic year, in which the company is attempting to complete its acquisition by Microsoft by June 30, 2023, analysts expect the company’s revenue and EPS to increase 11.1% and 11.7% year-over-year to $9.46 billion and $3.81 respectively.
Both revenue and EPS are expected to keep increasing over the next two years to come in at $10.35 billion and $4.39, respectively, for the fiscal ending December 31, 2025.
Premium Valuation
Given its stellar growth prospects, ATVI is trading at a premium compared to its peers. In terms of forward P/E, the stock is trading at 20.02x, 30.9% higher than the industry average of 15.30x.
In terms of the forward EV/EBITDA multiple, ATVI is currently trading at 14.17, which is 65.8% higher than the industry average of 8.55. Likewise, its forward Price/Sales multiple of 6.32 is significantly higher than the industry average of 1.26.
Technical Indicators Look Promising
MarketClub’s Trade Triangles show that ATVI has been trending UP for all the three-time horizons. The long-term trend has been UP since January 6, 2023, while the intermediate-term has been UP since February 15, 2023 and the short-term trend has been UP since March 2, 2023.
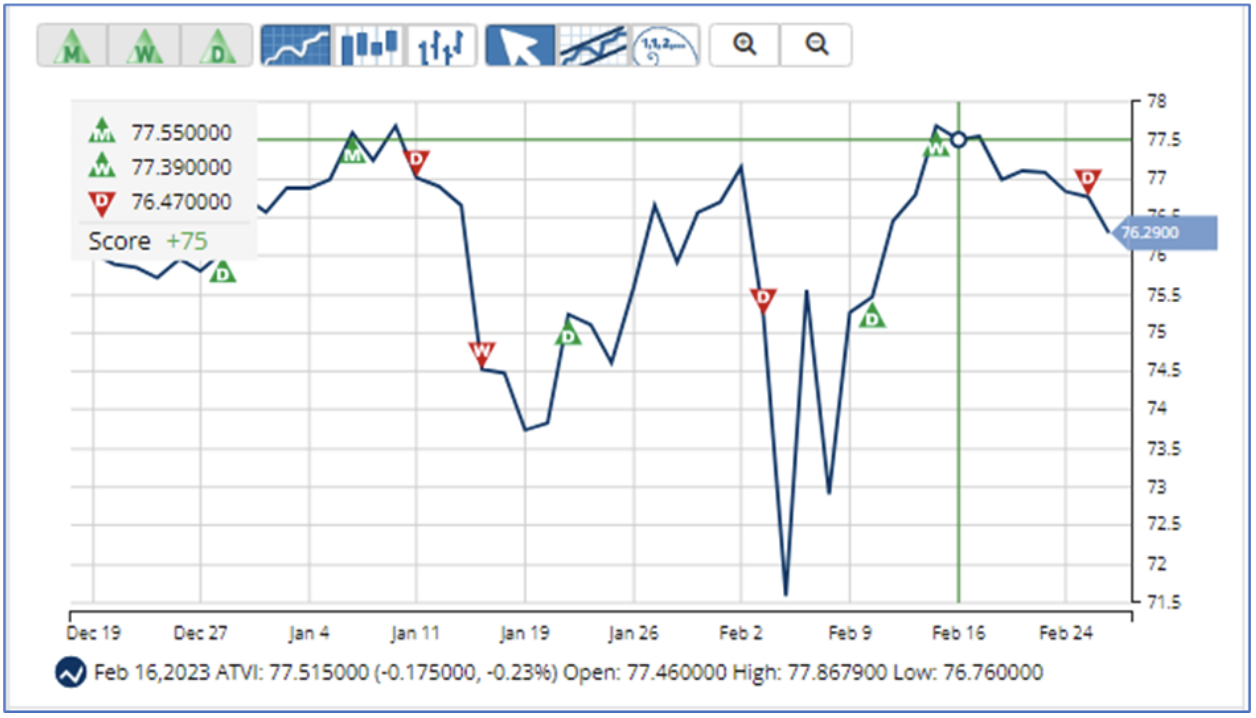
The Trade Triangles are our proprietary indicators, comprised of weighted factors that include (but are not necessarily limited to) price change, percentage change, moving averages, and new highs/lows. The Trade Triangles point in the direction of short-term, intermediate, and long-term trends, looking for periods of alignment and, therefore, intense swings in price.
In terms of the Chart Analysis Score, another MarketClub proprietary tool, ATVI scored +100 on a scale from -100 (strong downtrend) to +100 (strong uptrend), indicating that the strong uptrend will likely continue. Traders should protect gains and look for a change in score to suggest a slowdown in momentum.

The Chart Analysis Score measures trend strength and direction based on five different timing thresholds. This tool takes into account intraday price action, new daily, weekly, and monthly highs and lows, and moving averages.
Click here to see the latest Score and Signals for ATVI.
What's Next for This Stock?
Remember, the markets move fast and things may quickly change for this stocks. Our MarketClub members have access to entry and exit signals so they'll know when the trends starts to reverse.
Join MarketClub now to see the latest signals and scores, get alerts, and read member-exclusive analysis for over 350K stocks, futures, ETFs, forex pairs and mutual funds.
Best,
The MarketClub Team
su*****@in*.com