
Hello traders everywhere. It's hard to believe but as I write two of the three indexes are in positive territory for the week. Mid-week it looked like the stock market may be in rebound mode, only to fall close to the levels that we saw last week at weeks end and ultimately unable to break away from the 200-day moving average. The indexes look to be set up to retest the low levels from last week, and that could form a double bottom, much like the one we saw in April of this year.
The 200-day MA has proven to be a strong level of support this year rejecting several attempts by the market to break it, only to see the market bounce higher after each attempt. Will that trend continue?
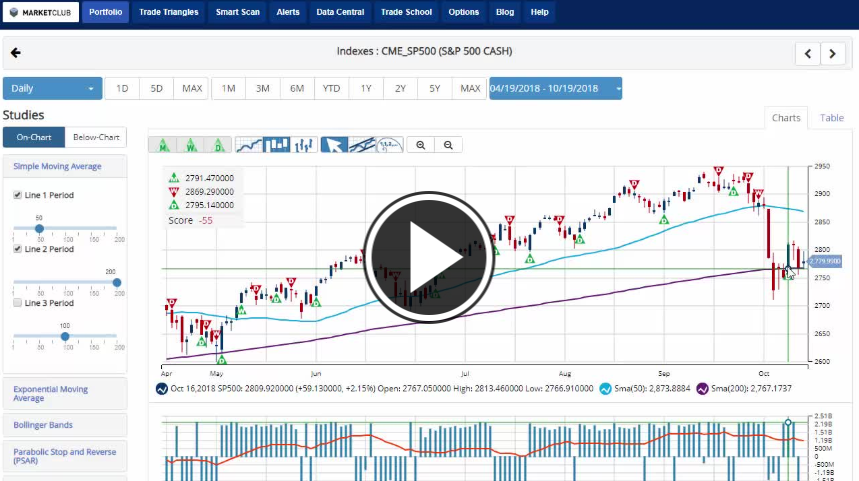
As crazy as it might seem even with this week's volatility both the S&P 500 and DOW are looking to post weekly gains of +.2% and +.4% respectively. However, the NASDAQ isn't playing along, and it is posting its third weekly loss in a row standing at -.4%.
The U.S. dollar had a bounce-back week of +.4% making this its third weekly gain out of the last four weeks. Crude oil has been under tremendous pressure triggering a new red weekly Trade Triangle at 70.64 and trading down -2.5% on the week. That's the second straight week of -2% losses for oil. Are we looking at $60 oil in our future?
Gold continues to fight to climb out of its long-term downtrend posting its third straight weekly gain, gaining +.6% so far this week. Continuing its move higher after triggering a new green weekly Trade Triangle last week. With stock market volatility looking to continue, look for gold to stay the course.
Bitcoin continues to disappoint showing no real movement to either side being range bound and trapped just below its 200-day MA. Look for this trend to continue until we get some big news or action in the cryptocurrency world.
Key Levels To Watch Next Week:
- S&P 500 (CME:SP500): 2,939.86/2,698.95
- Dow (INDEX:DJI): 26,951.81/24,077.56
- NASDAQ (NASDAQ:COMP): 8,107.38
- Gold (NYMEX:GC.Z18.E): 1,221.70
- Crude Oil (NYMEX:CL.Z18.E): 72.43
- U.S. Dollar (NYBOT:DX.Z18.E): 94.47
- Bitcoin (CME:BRTI): 6,637.89
Every Success,
Jeremy Lutz
INO.com and MarketClub.com