 If you are a long-term trader, here is how you may want to use MarketClub's Chart Analysis Score, Smart Scan and Trade Triangle technology...
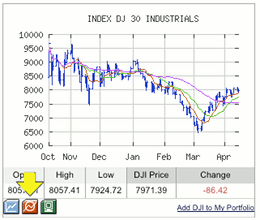
When you are in MarketClub, either the orange colored Chart Analysis Score button, or the link that says Chart Analyze will show you the score for the particular market that you choose. Both the button and the link are never far away from the small thumbnail sized chart.
Trade Triangle Method
As a long-term trader you want to pay particular attention to the fifth "Trade Triangle." This Triangle will generate a positive or negative long-term signal for you. If the fifth Triangle is GREEN, odds are in your favor if you are on the longside of the market. If the fifth Triangle is RED, the odds are in your favor if you are on the short-side of the market. This long-term signal works best with long-term investments such as mutual funds.
---
How It Works
The fifth Triangle is marked as GREEN whenever a market moves over the previous three month high and remains above the previous three month low. The reverse is true when the low of the previous months is broken to the downside; it creates a RED Triangle. This is an automatic stop-out of a long position with the RED Triangle signaling that a short sale is in order. If you are not familiar with short positions please consult your broker, or learn more from the experts in our INO TV online seminar service.
---
5 Successful Long-Term Trading Rules
(1) The odds are in your favor when you trade with the major trends.
(2) Always trade using stops. Never Cancel A Stop.
(3) Plan your trade and trade your plan.
(4) Never assume a market is too high or too low.
(5) Go with the flow. Don't over think your position.
Return To Chart Analysis Homepage
Return To Help Section Homepage

