Breaking Down Sony (SONY) Stock's 2023 Performance - The Ups, Downs, and Trends

Sony Group Corporation (SONY), the Japanese tech giant, recently confirmed raising the prices of its PlayStation Plus (PS Plus) subscription service by more than 30% across all benefit plans.

Implemented on September 6, 2023, the PS Plus Essential tier has gone up to $72-$80/year depending on where you’re located, with the PS Plus Extra increasing to a whopping $134/year. The most significant bump is for the Premium tier, which has increased by $40 to $159 for a year of access. This move has, predictably, not gone down well with the gaming fraternity.

SONY justified this decision, suggesting that the price adjustment is pivotal to ensure that the company can “continue bringing high-quality games and value-added benefits to your PlayStation Plus subscription service.”

Adding to its stance, the Tokyo-based company emphasizes the cost efficiency of its 12-month subscription plan, stating it provides a significant discount when compared to the cumulative cost of purchasing several one- or three-month plans during the same period.

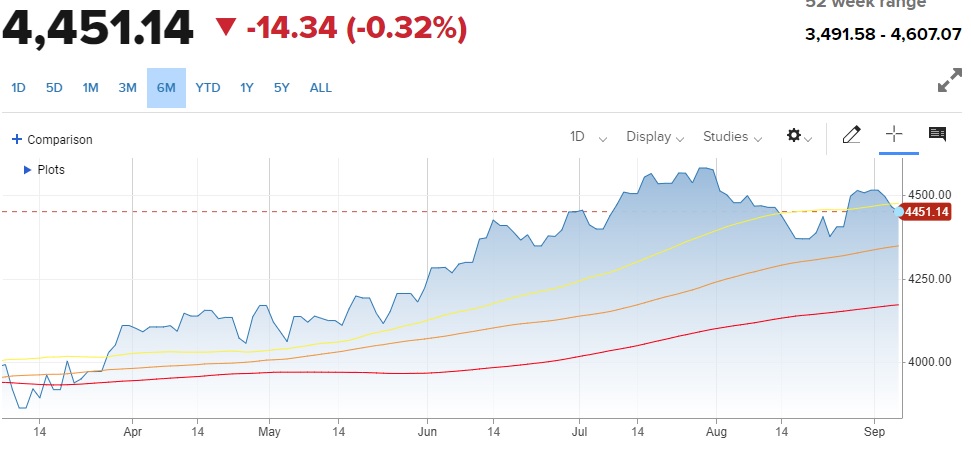
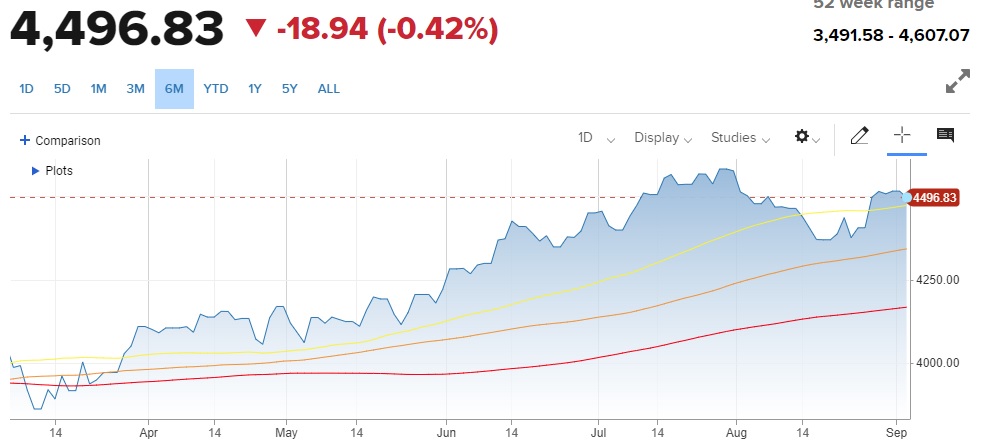
After the PlayStation Plus price hike announcement, SONY’s stock has risen the most since July. According to CLSA’s analyst Amit Garg, Sony’s move could cause a series of regular price increases from other subscription service providers.

This “steep” increase is expected to boost the company’s annual net sales by ¥100 billion, which is nearly $680.50 million. It could also add ¥55 billion (approximately $374.27 million) of operating profit annually. However, Amit Garg warned that there may be a fallout for gamer spending amid the challenging macroeconomic conditions.

Shares of SONY have gained nearly 2.5% over the past month and more than 10% year-to-date.

Although Sony’s rising stock price will benefit shareholders in the short term, gamers may be contemplating their PS Plus subscriptions, potentially leading to declined revenue in the long term.

Now, let’s review in detail what has happened over the year and discuss several factors that could impact SONY’s performance in the upcoming months:

Positive Recent Developments

On August 29, 2023, SONY’s subsidiary, Sony Electronics Inc., launched the wide-angle zoom lens G-Master™ FE 16-35mm F2.8 GM II, a 35mm full-frame α™ (Alpha™) E-mount lens that covers focal lengths from 16mm to 35mm with a maximum aperture of F2.8 over the entire zoom range.

The new launch FE 16-35mm F2.8 GM II satisfies the needs of photographers and videographers looking for high-performance lenses, with the descriptive power and high-speed AF (autofocus) unique to G Master.

Also, in the same month, the company unveiled two new additions to the Alpha 7C series of compact full-frame interchangeable lens cameras, the Alpha 7C II (model ILCE- 7CM2) and Alpha 7C R (model ILCE-7CR). These additions ensure top-tier imagery and visual performance across Sony’s state-of-the-art imaging devices and respond to the wide range of image expressions creators seek.

These fresh additions to the company’s product portfolio are expected to extend its market reach and drive its revenue stream and growth.

On June 6, Sony Electronics announced its partnership with SQUARE ENIX® on the latest standalone title in the esteemed FINAL FANTASY game franchise, FINAL FANTASY® XVI, available exclusively on PlayStation®5 (PS5™).

Deteriorating Financials

For the first quarter that ended June 30, 2023, SONY’s total sales and financial services revenue increased 32.9% year-over-year to ¥2.96 trillion ($20.14 billion). However, its operating income declined 30.1% year-over-year to ¥253.04 billion ($1.72 billion). The sharp drop in operating income was due to decreased profits in the company’s financial services and movie businesses.

Furthermore, the company’s adjusted EBITDA was ¥406.20 billion ($2.76 billion), down 18.3% year-over-year. Its net income decreased 16.6% from the year-ago value to ¥217.94 billion ($1.48 billion). Also, net income attributable to SONY’s stockholders came in at ¥175.67 per share, a decline of 16.2% year-over-year.

As of June 30, 2023, SONY’s cash and cash equivalents stood at ¥1.53 trillion ($10.41 billion), compared to ¥2.05 trillion ($13.95 billion) as of April 1, 2022.

Solid Historical Growth

Over the past three years, SONY’s revenue and EBIT grew at CAGRs of 13.9% and 8.1%, respectively. The company’s net income increased at a CAGR of 12.7% over the same time frame, while its EPS and total assets grew at 13.2% and 11.6% CAGRs, respectively.

Improved Full-Year Sales Forecast

Despite a disappointing financial performance in the last reported quarter, SONY raised its revenue forecast for the full year ending March 31, 2024, by 6.1% from the April forecast to ¥12.20 trillion ($83.02 billion), thanks to strength in its PlayStation gaming unit. The company made a 7% upward revision to its sales forecast for the Games & Network Services unit to ¥4.20 trillion ($28.58 billion).

Net income attributable to SONY’s stockholders is forecasted to be ¥860 billion ($5.85 billion), compared to its April forecast of ¥840 billion ($5.72 billion). The company’s August forecast for operating income remained unchanged at ¥270 billion ($1.84 billion). It expects full-year adjusted EBITDA of ¥1.75 trillion ($11.91 billion), which is also unchanged from the April forecast.

SONY is expecting a great year for its PlayStation gaming business. The company previously said it expects to sell a record 25 million PlayStation 5 units in the ongoing fiscal year 2024, compared with 19.1 million units in the prior year.

Moreover, the company sold 3.3 million units of the PlayStation 5 in its April-June quarter, an increase of 38% year-over-year. Although the numbers are softer compared with the December quarter, when consumer electronics tend to do well thanks to the holiday shopping period, it is still a solid result, given the macroeconomic weakness that has caused consumers to cut back their spending.

Piers Harding-Rolls, analyst at Ampere Analysis, said that Sony’s strong PlayStation results reflected its “much healthier position with regards to console availability.”

Warning About Delays in Smartphone Market Rebound

Last month, SONY warned about delays in the smartphone market recovery. The key supplier of image sensors, which are vital semiconductor components for smartphone photography and used by Apple Inc. (AAPL) and other device markers, said that it doesn’t expect demand in the smartphone market to bounce back until 2024 at the earliest due to sluggish demand in China and the U.S.

The entertainment and electronics group earlier said it expected a rebound in global smartphone sales in the second half of this year.

As a result, SONY expects its imaging sensors business to perform weaker than anticipated. For the full year 2024, the company’s operating income for the imaging sensors unit is projected to be ¥180 billion ($1.22 billion), down from an earlier forecast of ¥200 billion ($1.36 billion).  

Mixed Analyst Estimates

Analysts expect SONY’s EPS to decline 21.9% year-over-year to $1.13 for the fiscal 2024 second quarter ending September 2023. However, the company’s revenue for the ongoing quarter is estimated to increase 5.1% year-over-year to $19.53 billion. Moreover, it surpassed the consensus EPS estimates in all four trailing quarters and consensus revenue estimates in three of the trailing four quarters.

For the fiscal year 2024, the company’s EPS and revenue are expected to decrease 9.6% and increase 2,172.5% year-over-year to $5.04 and $81.88 billion, respectively. Analysts expect its EPS and revenue for the fiscal year 2025 to grow 12.1% and 2.2% from the previous year to $5.64 and $83.67 billion, respectively.

Bottom Line

SONY reported a nearly 31% decline in operating income in the fiscal 2024 first quarter as its life insurance and movies units dragged on its bottom line. Nevertheless, the company raised its full-year 2024 sales forecast due to an anticipated strength for its PlayStation gaming business.

While expecting strength in the PlayStation gaming business, SONY’s key image sensor business will likely get hit by the uncertainties associated with the smartphone market this year. Sony, last month, pushed back expectations for a smartphone market recovery to 2024 at the earliest following gauging worsening demand from China and the U.S.

After falling for most of this year due to smartphone market weakness, eroding gamer spending, and other macro headwinds, SONY’s stock rose its most in more than a month after the company hiked the price of its core gaming PlayStation Plus (PS Plus) subscription service by nearly a third, potentially boosting its bottom line.

While Sony already seems to be benefitting from the PS Plus price hike, some analysts warn that the increasing stock and revenue will only last for the short term as it may cause gamers to consider canceling their subscription, leading to declined sales in the long run.

Given this backdrop, waiting for a better entry point in this stock might be prudent. 


3 Stocks to Invest in Before the Housing Market Crashes


The housing market might crash in the near term as mortgage demand remains under pressure because of low housing inventory and high-average 30-year fixed mortgage rates.

Homebuyers locked into the sub-5% pandemic-era mortgage rates simply aren’t selling. The total number of homes on the market for the four weeks ending September 3, 2023, has declined 18% year-over-year, registering the biggest decline since February 2022. Meanwhile, new listings fell 9.3%.

Prospective home buyers have also been thwarted by rising property prices, which have increased for five months in a row. According to the National Association of Realtors (NAR), more than half of U.S. metro areas registered home price gains in the second quarter of 2023. It also reported that the median sale prices of existing homes are near record highs.

Last month, mortgage rates climbed to their highest level in 23 years. Mortgage rates have risen as the Federal Reserve undertook aggressive interest rate hikes since last year to curb high inflation. The weekly average of the 30-year fixed-rate mortgage as of September 7, 2023, stood at 7.12%.

The high mortgage rates led to mortgage applications reaching the lowest level since 1996. According to the Mortgage Bankers Association’s (MBA) Weekly Mortgage Applications Survey for the week ending September 1, 2023, mortgage applications fell 2.9% compared to the prior week.

MBA’s Vice President and Deputy Chief Economist Joel Kan said, “Mortgage applications declined to the lowest level since December 1996, despite a drop in mortgage rates. Both purchase and refinance applications fell, with the purchase index hitting a 28-year low, as prospective buyers remain on the sidelines due to low housing inventory and elevated mortgage rates.”

Freddie Mac’s chief economist Sam Khater said, “The economy remains buoyant, which is encouraging for consumers. Though inflation has decelerated, firmer economic data have put upward pressure on mortgage rates, which are straining potential homebuyers in the face of affordability challenges.”

Although nonfarm payrolls increased by 187,000 in August, the unemployment rate was 3.8%, up surprisingly from 3.5% in July. If unemployment keeps rising, it could lead to missed mortgage payments and foreclosures. With skyrocketing mortgage rates, high housing prices, and the possibility of a recession between now and July 2024 at 59%, a housing market crash is highly likely.

In the event of a housing crash, defensive stocks such as Walmart Inc. (WMT), American Water Works Company, Inc. (AWK), and Eagle Materials Inc. (EXP) will likely help cushion one’s portfolio. The products and services these companies provide are always in demand, irrespective of the economic cycles.

Let’s discuss these stocks in detail.

Walmart Inc. (WMT)

WMT engages in the operation of retail, wholesale, and other units worldwide. The company operates through three segments: Walmart U.S., Walmart International, and Sam's Club. 

WMT’s revenue grew at a CAGR of 5.2% over the past three years. Its EBITDA grew at a CAGR of 3.3% over the past three years. In addition, its EBIT grew at a CAGR of 4.6% in the same time frame.

In terms of the trailing-12-month Return on Common Equity, WMT’s 17.87% is 58.5% higher than the 11.28% industry average. Its 5.50% trailing-12-month Return on Total Assets is 28.1% higher than the 4.30% industry average. Likewise, its 2.51x trailing-12-month asset turnover ratio is 176.2% higher than the industry average of 0.91x.

WMT’s total revenues for the second quarter ended July 31, 2023, increased 5.9% year-over-year to $161.63 billion. The company’s adjusted operating income rose 8.1% over the prior-year quarter to $7.41 billion.

In addition, its consolidated net income attributable to WMT increased 53.3% over the prior-year quarter to $7.89 billion. Also, its adjusted EPS came in at $1.84, representing an increase of 4% year-over-year.

Analysts expect WMT’s EPS and revenue for the quarter ending October 31, 2023, to increase 0.7% and 4.5% year-over-year to $1.51 and $158.22 billion, respectively. It surpassed the Street EPS estimates in each of the trailing four quarters. Over the past year, the stock has gained 19.2% to close the last trading session at $164.52.

American Water Works Company, Inc. (AWK)

AWK provides water and wastewater services. It offers water and wastewater services to approximately 1,600 communities in 14 states, serving approximately 3.4 million active customers. The company serves residential customers; commercial customers, including food and beverage providers, commercial property developers and proprietors, and energy suppliers; fire service and private fire customers; etc.

AWK’s revenue grew at a CAGR of 3.1% over the past three years. Its net income grew at a CAGR of 11.9% over the past three years. In addition, its EPS grew at a CAGR of 10.9% in the same time frame.

In terms of the trailing-12-month gross profit margin, AWK’s 58.97% is 51.7% higher than the 38.86% industry average. Its 22.08% trailing-12-month net income margin is 133.6% higher than the 9.46% industry average. Likewise, its 10.35% trailing-12-month Return on Common Equity is 19% higher than the industry average of 8.70%.

For the fiscal second quarter ended June 30, 2023, AWK’s operating revenues increased 17.1% year-over-year to $1.10 billion. Its operating income rose 32.1% year-over-year to $432 million. The company’s net income attributable to common shareholders increased 28.4% over the prior year quarter to $280 million. Also, its EPS came in at $1.44, representing an increase of 20% year-over-year.

For the quarter ending September 30, 2023, AWK’s EPS and revenue are expected to increase 0.2% and 7.3% year-over-year to $1.63 and $1.16 billion, respectively. It surpassed the Street EPS estimates in three of the trailing four quarters. Over the past six months, the stock has gained 2.9% to close the last trading session at $137.56.

Eagle Materials Inc. (EXP)

EXP manufactures and sells heavy construction materials and light building materials. It operates in four segments: Cement, Concrete and Aggregates, Gypsum Wallboard, and Recycled Paperboard. The company engages in the mining of limestone for the manufacture, production, distribution, and sale of Portland cement; grinding and sale of slag; and mining of gypsum for the manufacture and sale of gypsum wallboards.

On May 3, 2023, EXP announced the completion of the acquisition of Martin Marietta’s cement import and distribution business in Northern California, including a cement terminal in Stockton, California. The acquisition bodes well for the company as it will help extend and strengthen its distribution reach across its heartland U.S. cement manufacturing system.

EXP’s President and CEO, Michael Haack, said, “Our Nevada Cement operations have long-standing customer relationships in Northern California, and this acquisition will uniquely position us to better serve these and new customers with complementary imported product.”

“Our entire cement system is currently ‘sold out’, and this acquisition will enable us to more actively participate in the strong US demand environment. Our experience as a cement importer elsewhere in the US is a transferrable expertise at Eagle, and we expect a smooth ownership transition,” he added.

EXP’s EBIT grew at a CAGR of 24.4% over the past three years. Its net income grew at a CAGR of 56% over the past three years. In addition, its levered FCF grew at a CAGR of 54.7% in the same time frame.

In terms of the trailing-12-month net income margin, EXP’s 21.82% is 230.7% higher than the 6.60% industry average. Its 13.32% trailing-12-month levered FCF margin is 269.3% higher than the 3.61% industry average. Likewise, its 34.36% trailing-12-month EBITDA margin is 98.7% higher than the industry average of 17.29%.

EXP’s revenue for the first quarter ended June 30, 2023, increased 7.1% year-over-year to $601.52 million. The company’s adjusted net earnings rose 17.2% over the prior-year quarter to $126.15 million. Its adjusted EPS came in at $3.55, representing an increase of 25.9% year-over-year. Also, its adjusted EBITDA increased 16.4% year-over-year to $214.29 million.

Street expects EXP’s EPS and revenue for the quarter ending September 30, 2023, to increase 13.5% and 4.9% year-over-year to $4.24 and $634.84 million, respectively. Over the past year, the stock has gained 48.4% to close the last trading session at $180.19.

Why Are Stocks Weak Again?

Please enjoy this updated version of weekly commentary from the Reitmeister Total Return newsletter. Steve Reitmeister is the CEO of StockNews.com and Editor of the Reitmeister Total Return.Click Here to learn more about Reitmeister Total Return


SPY – The fun of the 2023 bull rally is over. Now we are in a more volatile period where what happens next for the S&P 500 (SPY) is not so clear. That is why 43 year investment veteran Steve Reitmeister shares his latest market outlook, trading plan and top picks in this fresh commentary below…


My expectation of a trading range forming is playing out right on schedule. That being where resistance was found at 4,600 for the S&P 500 (SPY) which was simply too high after an overextended bull run.

On the other hand, there was no need for stocks to sell off more than 5%. Thus, support was found just above the 100 day moving average currently at 4,344.

Moving Averages: 50 Day (yellow), 100 Day (orange), 200 Day (red)

In a trading range scenario, the market is overly susceptible to each new headline. One day that blows bearish…and the very next day gloriously bullish.

In short, almost every move inside a trading range is meaningless noise. And thus should mostly be ignored.

That is because the VAST MAJORITY of the time, the market breaks out of the range in the same direction it was going before the range formed. In the current case that means we should break higher out of this range unless there is truly a threat to the bullish thesis.

That would require that the preponderance of the evidence starts to show that the odds of a recession have greatly increased. That is currently not true.

What is true is that we find that the recent economic data is a bit better than expected. Normally that is awesome news that has stocks spiking higher.

Unfortunately, that is not so awesome when the Fed is worried about lingering high inflation not fading away quickly enough. Simply stated…

The more robust the economy looks > the stickier high inflation becomes > the more likely the Fed raises rates even higher > the more they risk creating a recession instead of soft landing

Indeed, the recently improved economic picture has also increased the odds of a Fed rate hike at the November or December meetings. Just a month ago only 28% odds were placed another 25 basis point from the Fed. As for today that is now up to 46%. This again explains the stock market weakness this week.

Let me be clear…The improved data for ISM Services and Jobless Claims this week, that sparked the most recent sell off, does increase the odds of more rate hikes. But as Goldman Sachs predicts, the odds of a new recession forming in the next 12 months is still only around 25%. That means we are much more likely to have a soft landing which keeps the long term bullish thesis in place.

At this stage investors are likely going to react strongly to other upcoming economic events coming into the 9/20 Fed Rate decision. The roll call of reports includes:

9/13 Consumer Price Index

9/14 Producer Price Index, Retail Sales & Jobless Claims

9/20 Fed Rate

Note that right now most investors are expecting the Fed to hit the pause button on rates at this September 20th meeting. The key for investors is focusing on what Powell says at his press conference. That will provide their intentions for future meetings. Again, the odds for a rate increase in November or December is getting ever closer to 50%.

Trading Plan and Next Steps

Nobody knows when this trading range will end. But likely it will be before the holidays when the seasonal good tidings help to create a Santa Claus rally.

Thus, it is important look past the day to day fluctuations to appreciate that the long term picture is still bullish. This makes it wise to use meaningful dips in the range to buy the best looking stocks.

Which stocks are those?

More on that in the next section…

What To Do Next?

Discover my current portfolio of 7 stocks packed to the brim with the outperforming benefits found in our POWR Ratings model.

Plus, I have added 4 ETFs that are all in sectors well positioned to outpace the market in the weeks and months ahead.

This is all based on my 43 years of investing experience seeing bull markets…bear markets…and everything between.

If you are curious to learn more, and want to see these 11 hand selected trades, then please click the link below to get started now.

Steve Reitmeister’s Trading Plan & Top Picks >

Wishing you a world of investment success!


SPY shares were trading at $444.98 per share on Friday afternoon, up $0.13 (+0.03%). Year-to-date, SPY has gained 17.23%, versus a % rise in the benchmark S&P 500 index during the same period.


About the Author

Steve is better known to the StockNews audience as “Reity”. Not only is he the CEO of the firm, but he also shares his 40 years of investment experience in the Reitmeister Total Return portfolio. Learn more about Reity’s background, along with links to his most recent articles and stock picks.

Wall Street's D-Day on Sept. 13 Brings High Stakes – 5 Stocks to Consider in the Aftermath

August’s Consumer Price Index (CPI) report, due to be released on September 13, 2023, holds immense significance as it will influence the Federal Reserve’s upcoming policy decision. The Fed’s decision on raising interest rates at the next FOMC meeting scheduled on September 19-20, 2023, could be a significant determinant of the market movement.

August’s CPI figures are important, especially after a surprising rise in prices in July, with the headline CPI rising 3.2% year-over-year, the first acceleration in more than twelve months. August’s inflation numbers would offer insight into whether inflation is easing and July’s rise in prices was a one-off.

The central bank had last raised rates by 25 basis points in late July, pushing the benchmark interest rate to the 5.25% - 5.50% range. The recent economic data has been mixed with the U.S. consumer spending in July rising the most in six months, and nonfarm payrolls increased by 187,000 in August.

However, the unemployment rate rose 3.8% in August, the highest since February 2022. Additionally, job openings edged down to 8.8 million, falling to their lowest level since March 2021. Towards the end of last month, Fed Chair Jerome Powell said that inflation is still too high and could require additional interest rate increases. However, he noted that policymakers would carefully proceed as they assess the incoming data.

A rise in energy prices is expected to have driven the increase in headline inflation last month. Economists forecast headline inflation to rise 3.6% year-over-year and 0.6% sequentially in August. Federal Reserve governor Christopher Waller said he currently sees nothing that would force the Fed to raise the short-term borrowing rates again.

In an interview with CNBC, he stated, “The biggest thing is just inflation. We got two good reports in a row.” The key now is to “see whether this low inflation is a trend or if it was just an outlier or a fluke.”

When asked if rate increases can stop, Waller said, “That depends on the data.” “We have to wait and see if this inflation trend is continuing. We’ve been burned twice before. In 2021, we saw it coming down, and then it shot up. The end of 2022, we saw it coming down, then it all got revised away.”

“So, I want to be very careful about saying we’ve kind of done the job on inflation until we see a couple of months continuing along this trajectory before I say we’re done doing anything,” he added.

The CME FedWatch Tool indicated a 93% probability of the Fed keeping interest rates unchanged in September, while there is just a 53.5% probability for another pause at the November meeting.

Usually, interest rates and the stock market have an inverse relationship. If the prices rise higher than expected in August, the Fed might be compelled to raise interest rates, which could hurt the performance of stocks. In this scenario, investors may consider investing in stocks that are less sensitive to inflation, such as Unilever PLC (UL), Dominion Energy, Inc. (D), and Thermo Fisher Scientific Inc. (TMO).

On the other hand, if inflation shows signs of easing in August, the Fed may keep the benchmark interest rate steady. This could help stock prices to rise. In this scenario, investors may consider investing in cyclical names like Microsoft Corporation (MSFT) and NIKE, Inc. (NKE). They are deemed cyclical due to their sensitivity to rising interest rates. Without rate increases, these stocks are likely to perform well.

Let’s discuss these stocks in detail.

Microsoft Corporation (MSFT)

MSFT develops, licenses, and supports software, services, devices, and solutions worldwide. The company operates in three segments: Productivity and Business Processes, Intelligent Cloud, and More Personal Computing.

On April 17, 2023, MSFT and Epic announced the expansion of their strategic collaboration to develop and integrate generative AI into healthcare by combining the scale and power of Azure OpenAI Service with Epic’s electronic health record (EHR) software.

MSFT’s corporate vice president of AI platform, Eric Boyd, said, “Our expanded partnership builds on a long history of collaboration between Microsoft, Nuance, and Epic, including our work to help healthcare organizations migrate their Epic environments to Azure. Together, we can help providers deliver significant clinical and business outcomes leveraging the power of the Microsoft Cloud and Epic.”

MSFT’s revenue grew at a CAGR of 14% over the past three years. Its net income grew at a CAGR of 17.8% over the past three years. In addition, its EBIT grew at a CAGR of 18.7% in the same time frame.

In terms of trailing-12-month gross profit margin, MSFT’s 68.92% is 43% higher than the 48.20% industry average. Likewise, its 48.14% trailing-12-month EBITDA margin is 432.7% higher than the industry average of 9.04%. Furthermore, the stock’s trailing-12-month Capex/Sales came in at 13.26%, compared to the industry average of 2.42%.

MSFT’s total revenue increased 8.3% year-over-year to $56.19 billion for the fourth quarter ended June 30, 2023. Its net cash from operations increased 16.8% year-over-year to $28.77 billion. The company’s net income increased 20% year-over-year to $20.08 billion. Also, its EPS came in at $2.69, representing an increase of 20.6% year-over-year.

Analysts expect MSFT’s EPS and revenue for the quarter ending September 30, 2023, to increase 12.5% and 8.8% year-over-year to $2.64 and $54.51 billion, respectively. It surpassed the Street EPS estimates in each of the trailing four quarters. The stock has gained 39.4% year-to-date to close the last trading session at $334.27.

Thermo Fisher Scientific Inc. (TMO)

TMO provides life sciences solutions, analytical instruments, specialty diagnostics, and laboratory products, and biopharma services.

On August 14, 2023, TMO announced the completion of the acquisition of CorEvitas, LLC, a provider of regulatory-grade, real-world evidence for approved medical treatments and therapies, from Audax Private Equity.

TMO’s Chairman, President, and CEO Marc N. Casper said, “CorEvitas expands our clinical research business with highly complementary real-world evidence solutions, which is an increasingly important area and will help to enhance decision-making as well as the time and cost of drug development.”

“We are excited by the opportunity to further accelerate innovation and advance productivity for our pharma and biotech customers in their new work to deliver new medicines and therapeutics to benefit patients,” he added.

TMO’s revenue grew at a CAGR of 18.4% over the past three years. Its net income grew at a CAGR of 15.6% over the past three years. In addition, its EBITDA grew at a CAGR of 15.5% in the same time frame.

In terms of trailing-12-month net income margin, TMO’s 13.14% compares to the negative 5.71% industry average. Likewise, its 24.43% trailing-12-month EBITDA margin is 373.9% higher than the industry average of 5.15%. Furthermore, the stock’s 10.09% trailing-12-month levered FCF margin is significantly higher than the industry average of 0.23%.

For the fiscal second quarter ended July 1, 2023, TMO’s revenues declined 2.6% year-over-year to $10.69 billion. Its adjusted operating income decreased 9% over the prior year quarter to $2.37 billion. The company’s adjusted net income declined 8% year-over-year to $2 billion.

Also, its adjusted EPS came in at $5.15, representing a decline of 6.5% year-over-year. On the other hand, its non-GAAP free cash flow rose 21.9% year-over-year to $1.26 billion.

Street expects its EPS and revenue for the quarter ending September 30, 2023, to increase 11.5% and 0.5% year-over-year to $5.66 and $10.73 billion, respectively. Over the past three months, the stock has gained 0.6% to close the last trading session at $518.27.

NIKE, Inc. (NKE)

NKE is engaged in the designing, marketing, and distributing athletic footwear, apparel, equipment, and accessories for sports and fitness activities. Its brand product offerings are in Running, Basketball, the Jordan brand, Football, Training, and Sportswear.

Over the last three years, NKE’s revenue grew at an 11.1% CAGR, while its EPS grew at a 26.4% CAGR during the same time frame. Its net income grew at a 25.9% CAGR over the past three years.

In terms of trailing-12-month gross profit margin, NKE’s 43.52% is 22.8% higher than the 35.45% industry average. Likewise, its 11.55% trailing-12-month EBIT margin is 58.7% higher than the industry average of 7.28%. Furthermore, the stock’s 7.56% trailing-12-month levered FCF margin is 49% higher than the industry average of 5.08%.

NKE’s revenues for the fourth quarter ended May 31, 2023, increased 4.8% year-over-year to $12.83 billion. Its gross profit increased 1.7% year-over-year to $5.60 billion. The company’s net income declined 28.4% year-over-year to $1.03 billion. In addition, its EPS came in at $0.66, representing a decline of 26.7% year-over-year.

Analysts expect NKE’s revenue for the quarter ended August 31, 2023, to increase 2.5% year-over-year to $13 billion. Its EPS for the same quarter is expected to decline 19.3% year-over-year to $0.75. It surpassed consensus EPS estimates in three of the trailing four quarters. Over the past three months, the stock has declined 8% to close the last trading session at $97.67.

Unilever PLC (UL)

UL is based in London, the United Kingdom. It operates as a fast-moving consumer goods company. Its segments include Beauty & Wellbeing, Personal Care, Home Care, Nutrition, and Ice Cream.

UL’s revenue grew at a CAGR of 5.7% over the past three years. Its net income grew at a CAGR of 12% over the past three years. In addition, its EPS grew at a CAGR of 13.2% in the same time frame.

In terms of the trailing-12-month EBIT margin, UL’s 16.32% is 106.7% higher than the 7.89% industry average. Likewise, its 18.29% trailing-12-month EBITDA margin is 60% higher than the industry average of 11.43%. Furthermore, the stock’s 42.06% trailing-12-month Return on Common Equity is 273% higher than the industry average of 11.28%.

UL’s turnover for the first half ended June 30, 2023, increased 2.7% year-over-year to €30.43 billion ($32.55 billion). Its operating profit rose 22.6% year-over-year to €5.52 billion ($5.90 billion). The company’s net profit increased 20.7% year-over-year to €3.88 billion ($4.15 billion). Also, its EPS came in at €1.40, representing an increase of 23.6% year-over-year.

In addition, its net cash flow from operating activities increased 10.4% over the prior-year period to €3.37 billion ($3.61 billion).

For the quarter ending September 30, 2023, UL’s revenue is expected to increase 4.7% year-over-year to $16.53 billion. Its EPS for fiscal 2023 is expected to increase 4.9% year-over-year to $2.89. Over the past year, the stock has gained 12.2% to close the last trading session at $50.45.

Dominion Energy, Inc. (D)

D produces and distributes energy in the United States. It operates through four segments: Dominion Energy Virginia, Gas Distribution, Dominion Energy South Carolina, and Contracted assets.

On September 5, 2023, D announced that it concluded a robust and competitive sale process and executed three separate definitive agreements to sell its three natural gas distribution companies to Enbridge (ENB). The three LDCs include The East Ohio Gas Company, Public Service Company of North Carolina, Incorporated, Questar Gas Company, and Wexpro Company.

D's Chair, President, and CEO, Robert M. Blue, said, “The transactions announcement also represents another significant step in our business review, which is focused on repositioning the company to create maximum long-term value for shareholders, employees, customers, and other stakeholders.”

D’s net income grew at a CAGR of 62.4% over the past three years. Its EBITDA grew at a CAGR of 3.5% over the past three years. In addition, its EPS grew at a CAGR of 69.4% in the same time frame.

In terms of the trailing-12-month gross profit margin, D’s 46.31% is 19.2% higher than the 38.86% industry average. Likewise, its 45.90% trailing-12-month EBITDA margin is 40.2% higher than the industry average of 32.74%. Furthermore, the stock’s 50.59% trailing-12-month Capex/Sales is 73.2% higher than the industry average of 29.20%.

For the fiscal second quarter ended June 30, 2023, D’s operating revenue increased 5.5% year-over-year to $3.79 billion. Its adjustments to reported loss came in at $131 million, compared to adjustments to reported earnings of $1.11 billion. Its reported income per common share came in at $0.69, compared to a reported loss per common share of $0.58 in the prior-year quarter.

Street expects D’s revenue for the quarter ending September 30, 2023, to increase 3.4% year-over-year to $4.53 billion. On the other hand, its EPS for the same quarter is expected to decline 32.6% year-over-year to $0.79. It surpassed the Street EPS estimates in each of the trailing four quarters. Over the past month, the stock has declined 4.4% to close the last trading session at $47.12.

Are Stocks Ready to Make New Highs?

Please enjoy this updated version of weekly commentary from the Reitmeister Total Return newsletter. Steve Reitmeister is the CEO of StockNews.com and Editor of the Reitmeister Total Return.Click Here to learn more about Reitmeister Total Return


SPY – The recent sell off is over for the stock market…but are stocks really ready to make new highs above 4,600 for the S&P 500 (SPY)? 43 year investment veteran Steve Reitmeister shares his latest market outlook, trading plan and top picks in this fresh commentary below…


It’s been a couple weeks since my last commentary thanks to a much enjoyed vacation. Gladly most of that time stocks were in the plus column as the market rightfully bounced from recent weakness.

This fits in with my theory that we will be playing around in a trading range for a while. 4,600 for the S&P 500 (SPY) being the top end of the range and 100 day moving average (currently at 4,337) framing the bottom.

How long will we be in the range?

And what will be the catalyst to finally break out of the range?

And what are the best trades for this market environment?

Those key questions and more will be explored in this week’s Reitmeister Total Return commentary.

Market Commentary

As expected, the early August downturn was nothing more than a healthy round of profit taking after the tremendous bull run that started in March. Thus, after seeing a fairly customary 5% pullback investors were ready to hit the buy button again pushing stocks the S&P 500 higher.

Moving Averages: 50 Day (yellow), 100 Day (orange), 200 Day (red)

The recent bounce is nice…but are investors truly ready to break out of the range and make news highs above 4,600?

I believe the answer lies in a review of the recent slate of economic events. This should tell us if we have the proper catalysts in place to race to new heights:

8/25 Jay Powell @ Jackson Hole:  Remember that last time in 2022 Powell scared the pants off investors with his hawkish rhetoric. The key line being to expect economic pain (recession and job loss) before their war on inflation was over. This led to stocks going on a severe two month sell off to bear market lows in October 2022.

This time around Powell gave the usual sound bites. Inflation is too high…more work to do…may need to raise rates.

At first, investors were still in correction mode and hung on the words about “may need to raise rates”. This initially put some red arrows on the board. But as the day progressed investors realized that it was truly no different than any speech given by the Fed in the last several months. From there stocks leapt higher and have not looked back.

9/1 Government Employment Situation: Pretty much right on the money at 187K jobs added. The big surprise was how the unemployment rate unexpectedly jumped from 3.5% to 3.8% as the participation rate also went up. The best part of the report was that wage inflation continues to moderate with a lower than expected +0.2% month over month increase (that is only about 2.4% annualized…not far off the Fed’s target).

This all fits in with the narrative that the Fed is making serious headway with inflation and that more rate hikes are likely not needed. The bigger question is when rates can start to head lower. They say that is a 2024 issue…perhaps true. But it is still possible to start in late 2023. Either way it was welcome news to stocks that rallied hard on this news to end a strong week of price action.

Note that back on 8/29 the JOLTs report gave clues that the jobs market is softening with fewer and fewer job openings (see chart below). This trend also speaks to the likelihood of moderating wage growth which is one of the stickier parts of the inflation picture.

9/1 ISM Manufacturing: This has been the weakest part of the economic picture with 9 straight readings under 50. Make that 10 months now with the 47.6 reading. Gladly that is the 2nd straight month of improvement. Note the PMI version of this monthly report was even more optimistic.

And now a glimpse of the key reports that lie ahead:

9/6 ISM Services: This is the larger, and healthier part of the economy where we got a 52.7 reading last month. Right now expectations call for a fairly similar reading of 52.4. Yet I suspect the strength of the most recent Retail Sales report may say there is some upside to that number.

9/13 Consumer Price Index (CPI): Investors like to focus on this inflation report even though the Fed has consistently said they find the Core PCE reading to be the much more reliable inflation indicator. Regardless, this has been trending nicely lower and mostly coming in under expectations for the past several months.

Too much focus is given to the year over the year # which has a lot to do with inflation many months ago. That is why experts like to drill down to the month over month readings which gives a sense of the current pace of things. That is expected to modulate to +0.2% which again is getting much closer to the Fed’s 2% annualized target. And will have folks readjusting odds for what happens  on the next item…

9/20 Fed Rate Announcement: Right now it’s a forgone conclusion the Fed will stay put on rates at this meeting. What is not as certain is whether they have one more rate hike up their sleeves…and when they finally start lowering rates as the longer they leave these restrictive policies in place…the more they risk a recession forming.

Right now the CME calculates 40% odds of 1 more hike by the end of the year (either at November or December meeting). Honestly, with the facts in hand, I don’t see that happening. The nails are already in the inflation coffin. Just better to apply some patience to see it through as Fed policy typically has 6+ months of lagged effects.

Expectations & Trading Plan

We are in a young bull market…but still not out 100% out of the woods. Meaning the Fed has a history of going too far with their policies thereby creating a recession.

I sense this group is wiser than some of their predecessors and will manage the soft landing from which they can lower rates…which will be an elixir for economic growth…earnings growth…and share price growth.

So for as positive as recent economic news has been, for right now I expect a bit more time in the aforementioned trading range (4,337 to 4,600). And that time will likely be volatile with no seeming direction. That is the very nature of trading ranges.

All you have to do is keep your eyes on the long term horizon which is bullish which gives you ample reason to load up on the best stocks now for WHENVER the catalysts come to push them higher. Meaning don’t stay on the sidelines any longer. The time to get on the bull train is now.

The next section will discuss a bit more about which are the best investments to stay a step ahead of the pack.

What To Do Next?

Discover my current portfolio of 7 stocks packed to the brim with the outperforming benefits found in our POWR Ratings model.

Plus I have added 4 ETFs that are all in sectors well positioned to outpace the market in the weeks and months ahead.

This is all based on my 43 years of investing experience seeing bull markets…bear markets…and everything between.

If you are curious to learn more, and want to see these 11 hand selected trades, then please click the link below to get started now.

Steve Reitmeister’s Trading Plan & Top Picks >

Wishing you a world of investment success!


SPY shares . Year-to-date, SPY has gained 18.36%, versus a % rise in the benchmark S&P 500 index during the same period.


About the Author

Steve is better known to the StockNews audience as “Reity”. Not only is he the CEO of the firm, but he also shares his 40 years of investment experience in the Reitmeister Total Return portfolio. Learn more about Reity’s background, along with links to his most recent articles and stock picks.