Please enjoy this updated version of weekly commentary from the Reitmeister Total Return newsletter. Steve Reitmeister is the CEO of StockNews.com and Editor of the Reitmeister Total Return.Click Here to learn more about Reitmeister Total Return
SPY – Once again stocks flirted with the all time highs for the S&P 500 (SPY). This has happened 2 times recent both leading to failure and this 3rd time doesn’t seem to be the charm either. What is holding stocks back from making new highs? And what should an investor do to find better performance? 43 year investment veteran Steve Reitmeister shares his view including a preview of his 11 favorite stock picks now. Read on below for the answers…
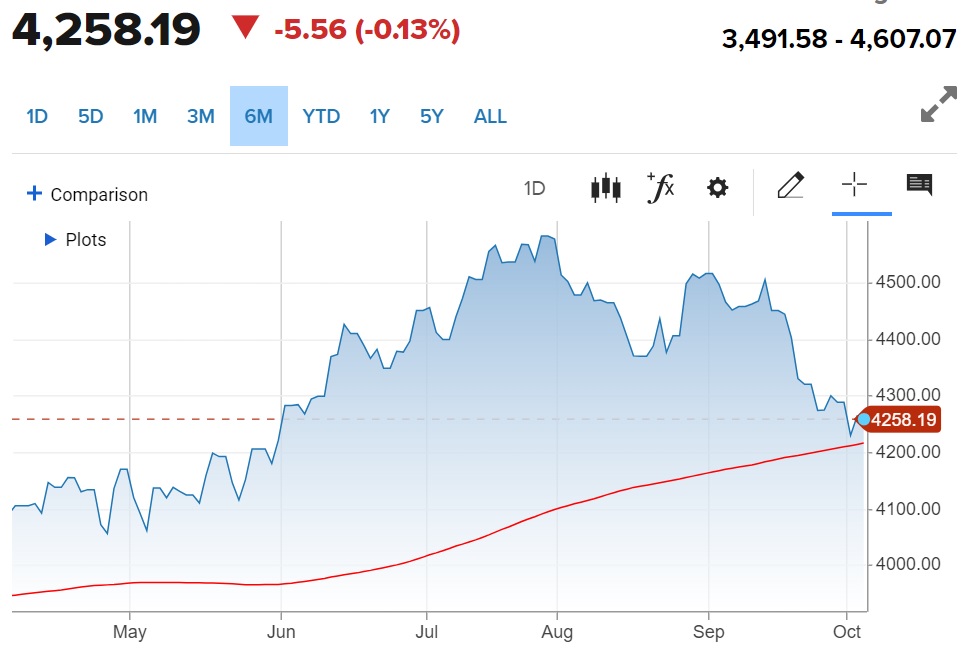
In my recent commentaries I have speculated that we were due for a trading range to digest some of the rampant gains at the end of 2023. However, so far it has been more of a consolidation under the all time highs at 4,796 for the S&P 500 (SPY).
Consolidations are simply much tighter trading ranges. That investors refuse to have a serious sell off while also not being ready to climb higher. Kind of feels like cars revving up at the starting line of a race…lots of noise, but going nowhere.
We will discuss more of the reasons behind this consolidation and when stocks should be ready to race ahead.
Market Commentary
Stocks have tried twice over to make new all time highs above 4,800 for the S&P 500. And twice thwarted at that level followed by share pullbacks.
Yes it looks like Thursday’s action signals a 3rd such attempt. Yet that was a very hollow rally with the usual suspects in the S&P 500 doing well with small caps and other riskier stocks lagging. That is not the sign of a healthy bull. And give very low odds of breaking to new highs.
(1/20/24 update: Yes, the S&P 500 officially made new highs above 4,800 on Friday. I honestly thought it was a fairly hollow rally mostly led by the usual mega cap tech stocks and not such a broad rally. Meaning I do not believe this rally has staying power and likely will fall back below 4,800 this coming week. And at best we consolidate just above 4,800 with little true upside coming in the days ahead).
Some are pointing to economic data being too weak as the problem. Such as the horrific -43 showing for the Empire State Manufacturing Index on Tuesday.
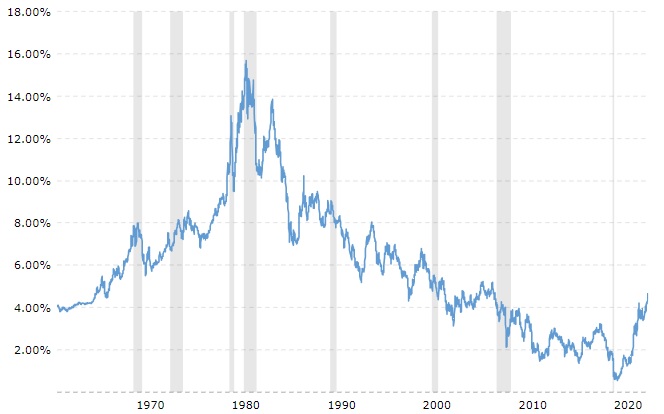
While others are pointing to economic data being too strong like Retail Sales being above expectations on Thursday. This had 10 Year Treasury rates breaking further above 4% and also lowered the odds of the first rate cut coming at the March Fed meeting.
Sorry folks…you can’t have it both ways. And perhaps the answer is that neither of these theses are correct.
Meaning I don’t believe that investors are truly worried about a looming recession. Nor are they fearful of rates spiking again as they did in the Fall of 2023.
Simply, the market has come a long way from bear market bottom in October 2022. A total gain of 37% from that valley to now is a lot of profit in a short time when the long term average annual gain for the S&P 500 is only 8%.
So now is a healthy time for an extended pause. The same way you would take a long break after running a marathon.
Rest is what is needed. And then gaining the strength for the next run higher.
In the stock market world that typically comes hand in hand with a pullback in price leading to a trading range. Along with that you will see these investment terms show up more often:
- Profit taking
- Sector rotation
- Change of leadership
- Buy the Dip
- The Pause that Refreshes
- And so on…
Yet right now the most apt term is consolidation. As shared up top, that is simply a very tight trading range right under a point of resistance. Currently that resistance corresponds with the all time closing highs at 4,796…but for simplicity easier to think of it as 4,800.
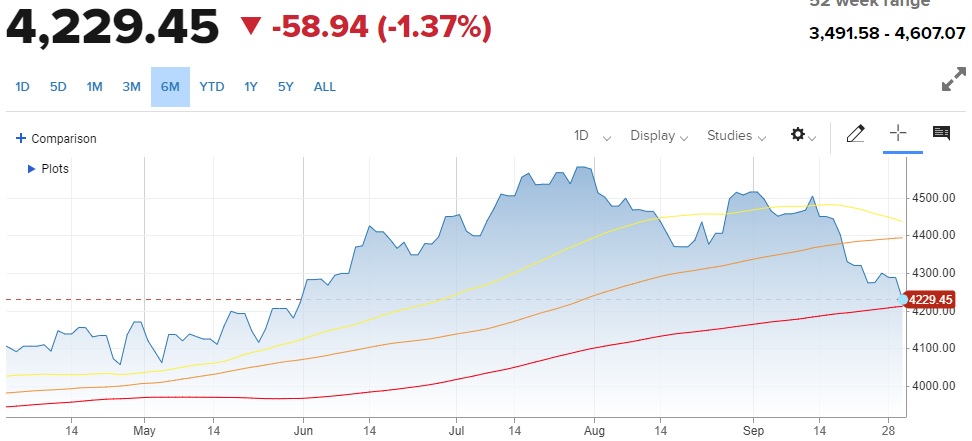
The point is at this stage it is healthy and normal for stocks to relax after such a long run higher. Don’t be surprised if the consolidation does turn into a wider trading range with a subsequent test of the 50 day moving average at 4,628 being a likely downside target.
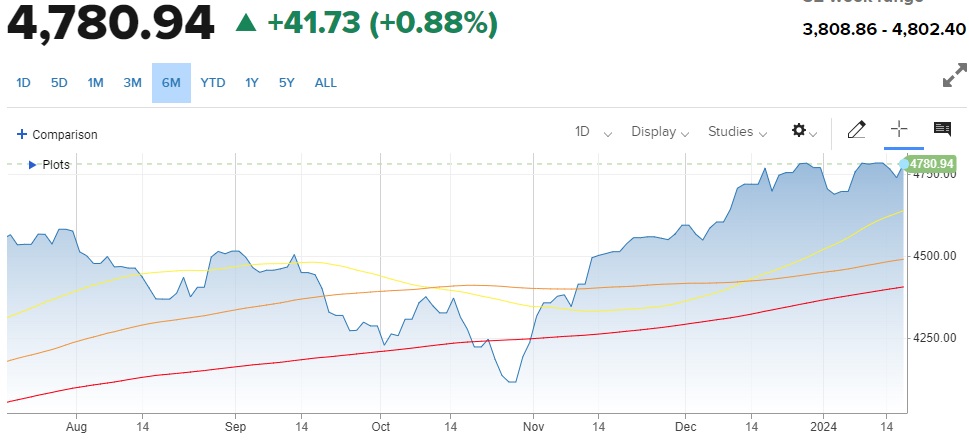
Moving Averages: 50 Day (yellow), 100 Day (orange), 200 Day (red)
A break below 4,600 is unlikely without some greater fundamental concerns arising. But let’s do appreciate the 2 next levels of price support rest at 4,488 for 100 day moving average and about 4,400 for the 200 day moving average.
Your trading plan should be to stay bullish. Use any subsequent pullback as a buy the dip opportunity. NOT for the stocks that led the charge in 2023. That game plan is played out.
Instead valuation and quality will be held in higher regard this year as the overall PE of the market is not cheap. GAARP is fine (Growth At A Reasonable Price)…but not growth at ANY price like last year.
If you want my favorite stock ideas for 2024, then read on below…
What To Do Next?
Discover my current portfolio of 11 stocks packed to the brim with the outperforming benefits found in our exclusive POWR Ratings model.
Yes, that same POWR Ratings model generating nearly 4X better than the S&P 500 going back to 1999.
Plus I have selected 2 special ETFs that are all in sectors well positioned to outpace the market in the weeks and months ahead.
These 13 top trades are based on my 43 years of investing experience seeing bull markets…bear markets…and everything between.
If you are curious to learn more, and want to see these lucky 13 hand selected trades, then please click the link below to get started now.
Steve Reitmeister’s Trading Plan & Top Picks >
Wishing you a world of investment success!

Steve Reitmeister…but everyone calls me Reity (pronounced “Righty”)
CEO, StockNews.com and Editor, Reitmeister Total Return
About the Author
Steve is better known to the StockNews audience as “Reity”. Not only is he the CEO of the firm, but he also shares his 40 years of investment experience in the Reitmeister Total Return portfolio. Learn more about Reity’s background, along with links to his most recent articles and stock picks.