
Each Week Longleaftrading.com will be providing us a chart of the week as analyzed by a member of their team. We hope that you enjoy and learn from this new feature.
June Natural Gas (NYMEX:NG.M14.E) opened sharply higher in Sunday evenings session, but since the open prices plummeted to a 5 day low. The sell off confirmed a bearish outside reversal ahead of today's US session. June Natural Gas futures remain under pressure from last week's EIA storage report that showed a larger than expected supply build of 82 bcf. Recent weather forecasts have been calling for warmer temperatures across the country which could limit the size of upcoming supply injections.
In recent weeks, we have been in a sideways trend in the June Natural Gas Market as the market decides on which direction it is headed next. The technical analysis in Natural Gas points to bearish in the near-term, making way for a potential swing trading opportunity.
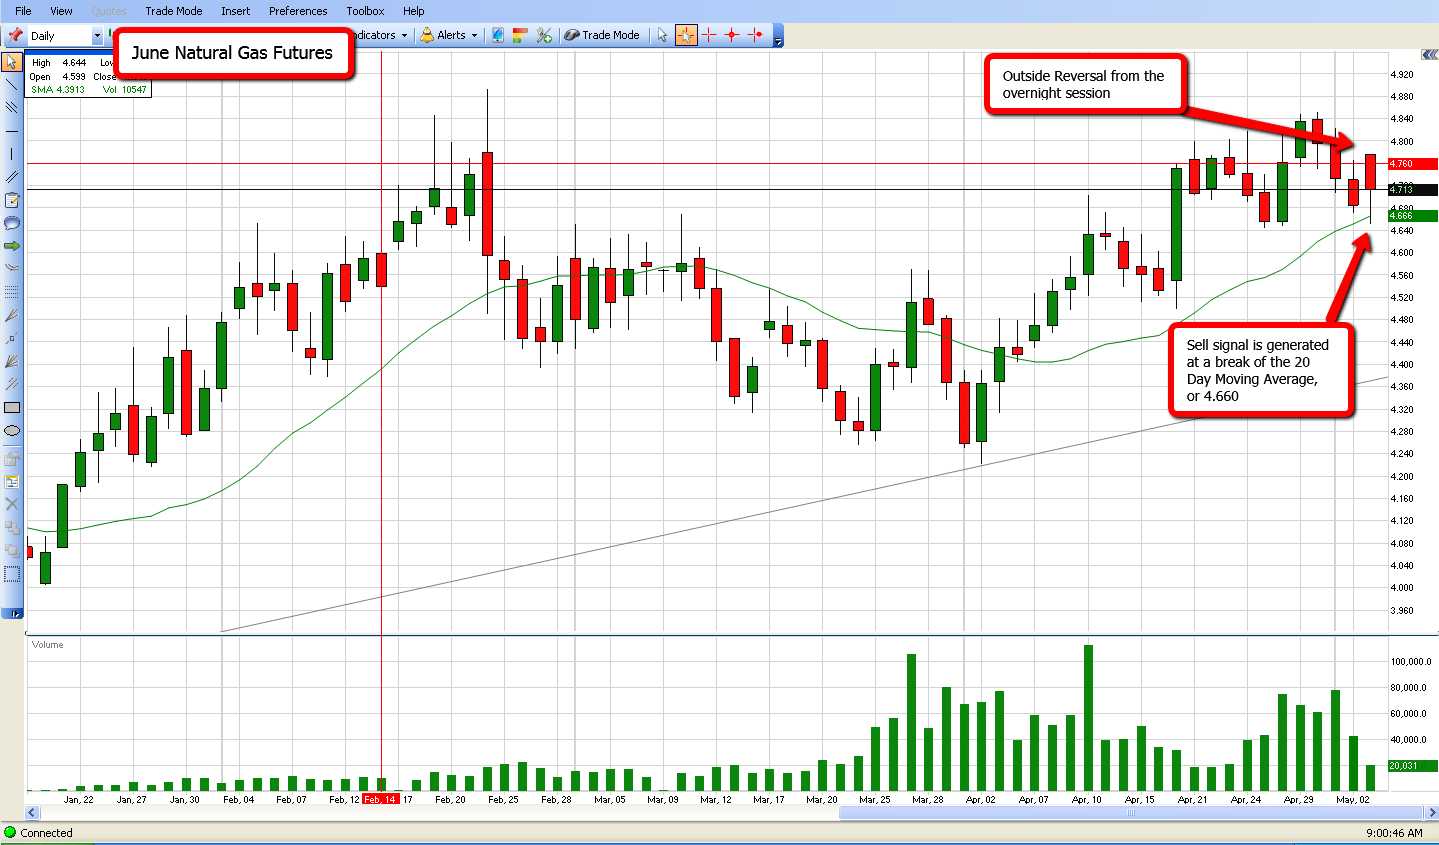
In today's trading session, I will be looking to sell June Natural Gas futures at 4.660, or a breach of the 20 Day Moving Average. This breach would confirm the outside reversal in today’s trading session. Continue reading "Chart of The Week - Natural Gas"