Stock Market vs. Bond Rate Relationship Revealed

Please enjoy this updated version of weekly commentary from the Reitmeister Total Return newsletter. Steve Reitmeister is the CEO of StockNews.com and Editor of the Reitmeister Total Return.Click Here to learn more about Reitmeister Total Return


SPY – The stock market is affected by many things like the Fed and the economy. However, there is not enough talk about how the movement of bond rates makes stocks more or less attractive. Like how the S&P 500 (SPY) is having a terrible September as bond rates explode higher. Learn more about this dynamic relationship and what it means for stock prices in the days ahead.

Investors have long appreciated the relationship that when rates go up…stocks go down.

That was a prime catalyst behind the 2022 bear market. Yet investors were encouraged in 2023 that inflation was coming under control…and thus rates would head lower in the future. This had stocks back on the rise for the majority of the year.

Then on 9/20 the Fed said “NOT SO FAST!” which had rates spiking again…and investors fleeing stocks.

Did that story take a turn for the better on Thursday?

Let’s review in this week’s commentary.

Market Commentary

The best place to start our conversation is with this 1 month chart showing the rise of the 10 Year Treasury rate vs. the decline of the S&P 500 (SPY):

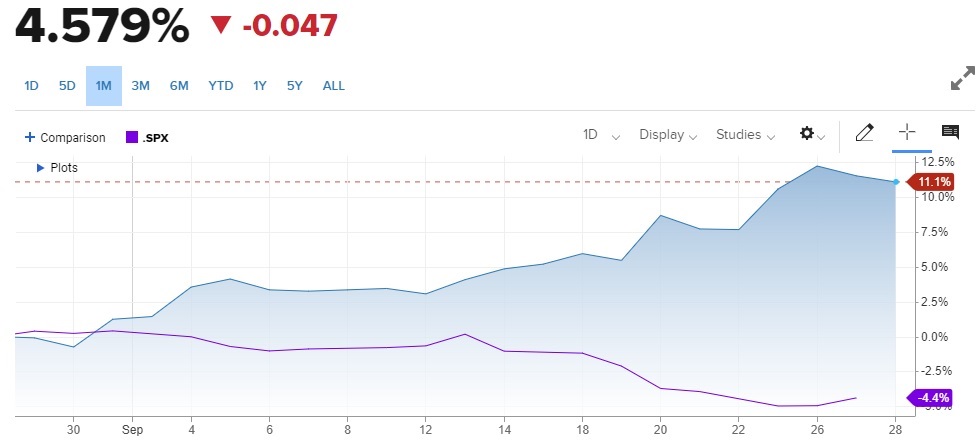
The inverse relationship is quite apparent. As rates accelerated higher later in the month…the stock decline accelerated as well.

The reasons behind the higher rates was explained in detail in my commentary after the 9/20 Fed announcement. Here is the core section for our discussion today:

“…Nutshell of the Wednesday Fed announcement.

The economy is doing better than we expected…so it’s going to take a bit longer to bring down inflation to target level…the good news is that we really believe we can do it without creating a recession.

So why did stocks go down on this seemingly positive outlook?

Because the dot plot of rate expectations by Fed officials now has the end of 2024 rate still way up at 5.1%. That was revised higher from the previous estimate of 4.6%.

Yes, this most certainly fits in with the Fed narrative of “higher rates for longer”, but much longer and higher than investors previously anticipated.”

Now let’s narrow in on what happened with 10 year Treasury rates on Thursday:

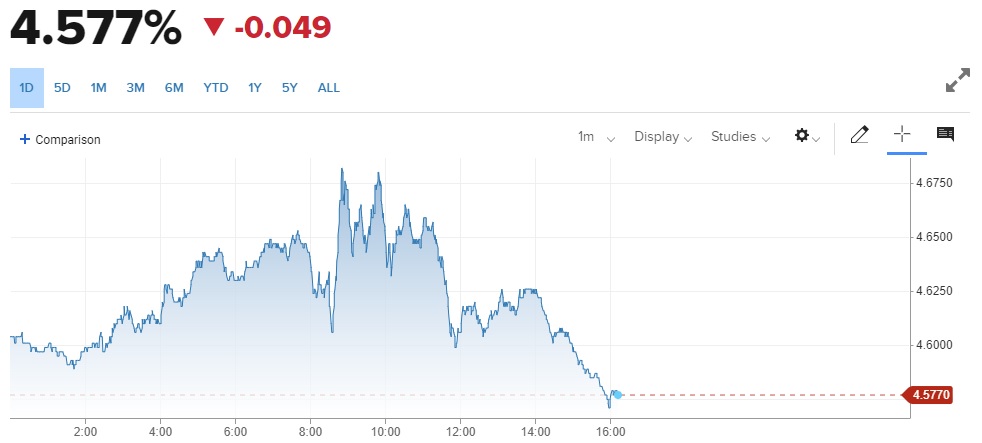
This one day chart shows how rates continued to spike early in the session Thursday up towards a high of 4.688%. Yet dramatically reversed course ending the session down at 4.577%. That also helped stocks enjoy one of their best sessions in a while. (The bond sell off extended into Friday which increases the odds we have seen peak rates).

Please remember that rates were down around 3.8% just a couple months ago. This is a dramatic move that may have finally run its course. If so, then it helps improve the odds that we have made a bottom with stocks moving higher from here.

The biggest surprise I see with the recent rise in bond rates is how the likelihood of a rate hike at the November 1st Fed meeting has dropped from 62% just a month ago to only 19% as of today. Further the idea of a raise happening by the December 13th meeting has declined to 36%.

This information just doesn’t jive with Fed statements in September which seemed to indicate strong likelihood of at least one more hike. Nor does it jive with soaring bond rates. Again, perhaps another clue that the rally in bond rates is overextended and ready to retreat which is good for stocks.

Pulling back to the big picture it is very hard to have a bear market without a recession forming. And right now the odds of that are fairly low.

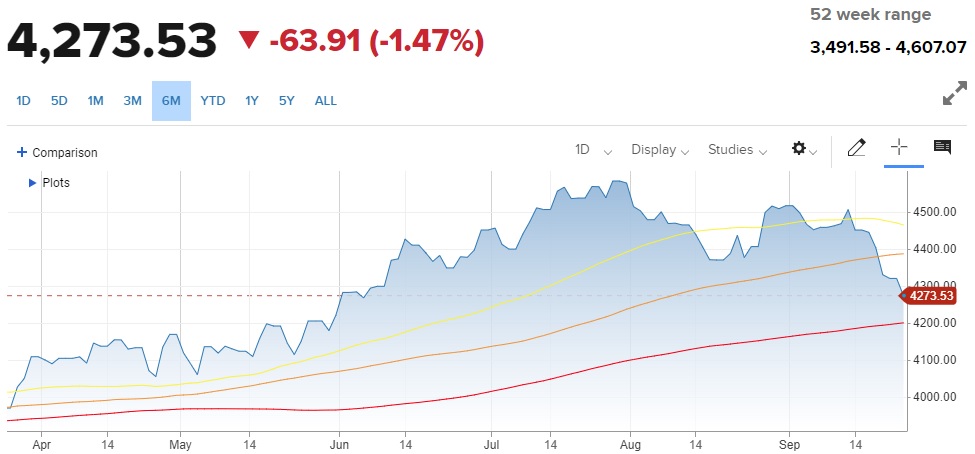
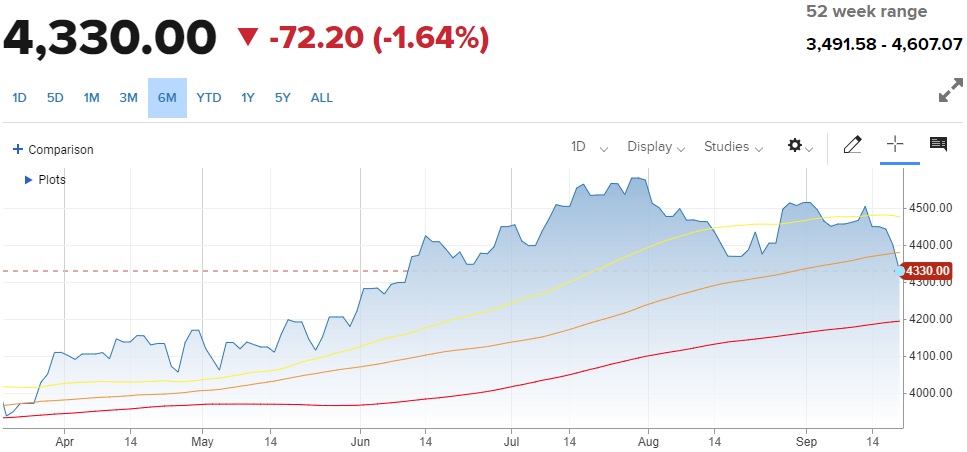
That is why I believe that this sell off is finding a bottom around current levels. And perhaps no further than the 200 day moving average closing in on 4,200. That is the downside possibility.

Whereas the upside potential this year has us retesting the highs of 4,600 seen in late July. And then next year likely cracking above 5,000.

Thus, I recommend staying fully invested in this market. The key to success is picking the best investments. And that is what we will cover in the next section…

What To Do Next?

Discover my brand new “2024 Stock Market Outlook” covering:

  • Bear Case vs. Bull Case
  • Trading Plan to Outperform
  • Top 11 Picks for the Year Ahead
  • And Much More!

Gain access to this vital presentation now by clicking below:

2024 Stock Market Outlook >

Wishing you a world of investment success!


Steve Reitmeister…but everyone calls me Reity (pronounced “Righty”)
CEO, StockNews.com and Editor, Reitmeister Total Return


About the Author

Steve is better known to the StockNews audience as “Reity”. Not only is he the CEO of the firm, but he also shares his 40 years of investment experience in the Reitmeister Total Return portfolio. Learn more about Reity’s background, along with links to his most recent articles and stock picks.

How Low Will Stocks Go?

Please enjoy this updated version of weekly commentary from the Reitmeister Total Return newsletter. Steve Reitmeister is the CEO of StockNews.com and Editor of the Reitmeister Total Return.Click Here to learn more about Reitmeister Total Return


SPY – The Fed threw some gasoline on the stock sell off fire last week. With that stocks are exploring new lows with the 200 day moving average in play at 4,195 for the S&P 500 (SPY). Is it time to buy stocks…or run for cover? 43 year investment veteran Steve Reitmeister shares his latest insights including how low he expects stocks to go. Plus information on his top 11 picks for today’s volatile market. Read on below for more…


Stocks were floating around in a well-defined trading range coming into the September 20th Fed announcement. Unfortunately, the increased clarity on what they mean by “higher rates for longer” has the market heading to new lows.

This has rattled the cage of some investors evoking questions like:

Is the bull market already over?

How low do we go before stocks bounce again?

We will answer all that and more in this week’s Reitmeister Total Return commentary.

Market Commentary

4,600 on the S&P 500 (SPY) was always too high for this market. Especially true when it was unclear when the Fed would be done tapping the brakes of the economy. Thus, it made sense for investors to take some money off the table in early August leading to a natural pullback.

Next up the Fed made it clearer what “higher rates for longer” meant at their 9/20 press conference. This included the September release of their Summary of Economic Projections which included insight that Fed officials now expect rates to be around 5.1% at the end of 2024…much higher than the previously stated level.

This has led to a massive Risk Off adjustment as it does marginally increase the odds of recession (and bear market). But more succinctly it means that bonds and interest bearing securities have become more attractive relative to stocks thanks to higher yields. Or to put it another way:

Rates Up > Stocks Down

Now let’s pull back to the big picture. Even after this realignment of funds, investors have to appreciate that the risk of recession is still very low. The Fed is simply choosing a path of lightly tapping on the brakes over a longer period of time to increase the odds of soft landing.

This is a better plan than violently slamming on the brakes with MUCH higher rates in the short run which increases the probability of an economic wreck in the long run.

This all shows up loud and clear in how they adjusted their economic forecast for 2024 higher to +1.5% GDP growth. Not stellar when 2.7% is the long term average. However, it sure is better than the 1.1% they previously projected.

Now let’s consider some other GDP indicators.

Goldman Sachs is staying put at 15% odds of recession in the coming year. Note that economists are told to start at 10% probability no matter how glorious the economy looks. So this means their teams sees very little reason for concern.

Next we will check in with the famed GDPNow model from the Atlanta Fed. That is shockingly high at +4.9% for Q3. That is just based on 1 month of data so far and likely will come down a notch when the early October reports are released like ISM Manufacturing and Retail Sales.

Likely the GDPNow model will fall in line with the Blue Chip Economist panel that right now stands at +2.9% for Q3. Last quarter the panel forecast was much closer to the mark.

When you boil it down it is hard to see that the odds of recession are that high. And thus hard to become bearish…and thus hard to see stocks falling much further. Will discuss more about that in the next section…

Price Action & Trading Plan

Moving Averages: 50 Day (yellow), 100 Day (orange), 200 Day (red)

We have been under the 100 day for a few sessions. So, it means that the 200 day moving average @ 4,195 is now in play (about 2% below Thursday’s close).

I didn’t think that was probable a week ago. But the Fed’s updated forecast means that the highly anticipated lowering of rates, and reacceleration for the economy, are a bit further down the road.

It doesn’t end the bull market story. Rather it just delays when it will really show up in improved earnings growth, which is the prime catalyst for higher share prices.

So yes, the odds of testing the 200 day moving average has increased. That is a healthy correction for the overall market after being near 4,600 back in July.

That correction will shake out the complacency that got built up during the overextend 5 month rally from March til August. This creates a healthy reset for stocks bringing them down to a better valuation point that will have investors more readily hitting the buy button once again. My guess is that will be at the 200 day moving average or slightly above.

This new information on the Fed also has me taking back my previous prediction of 4,850 for year end S&P 500 level. That is asking too much from the market at this time.

Rather, I think a touch of Santa Claus rally, plus increased clarity from the Fed at their next 2 meetings, will give investors the confidence to bid stocks back up to 4,500 to 4,600 by year end. And then be primed to make new highs above 5,000 next year.

The key to superior returns is determining the best stocks & ETFs to put into our portfolios to stay a step ahead of the pack. And that is what you will find in the next section…

What To Do Next?

Discover my current portfolio of 7 stocks packed to the brim with the outperforming benefits found in our POWR Ratings model.

Plus I have added 4 ETFs that are all in sectors well positioned to outpace the market in the weeks and months ahead.

This is all based on my 43 years of investing experience seeing bull markets…bear markets…and everything between.

If you are curious to learn more, and want to see these 11 hand selected trades, then please click the link below to get started now.

Steve Reitmeister’s Trading Plan & Top Picks >

Wishing you a world of investment success!


Steve Reitmeister…but everyone calls me Reity (pronounced “Righty”)
CEO, StockNews.com and Editor, Reitmeister Total Return


About the Author

Steve is better known to the StockNews audience as “Reity”. Not only is he the CEO of the firm, but he also shares his 40 years of investment experience in the Reitmeister Total Return portfolio. Learn more about Reity’s background, along with links to his most recent articles and stock picks.

100 Best Stocks for October

Please enjoy this updated version of weekly commentary from the Reitmeister Total Return newsletter. Steve Reitmeister is the CEO of StockNews.com and Editor of the Reitmeister Total Return.Click Here to learn more about Reitmeister Total Return


SPY – Our computer models are dialed into the 100 best stocks for October 2023. What makes them “the best stocks”? Years of hard work to find the precise factors that lead to market beating stocks (SPY). Like our coveted strategy with an average annual return of +57.15%. And yes, it even produced impressive profits during the 2022 bear market. Now is the time to discover the winning stocks it is picking for the weeks and months ahead. Get full details below…

We received a record response to my most recent presentation—where I shared our most profitable solution for investors—so I wanted to reach out once more to make sure you didn’t miss it:

100 Best Stocks for October >

This revolutionary trading system actually consists of 10 different “black box” trading strategies each with precisely 10 stocks each.

I am referring to our coveted “low priced” stock strategy sporting an average annual return of +57.15%.

And yes, it was profitable during the 2022 bear market putting the S&P 500 (SPY) to shame.

And yes, it has come roaring out of the gate once again in 2023!

To create proven strategies like these, we turned to the same Data Scientist who created our coveted POWR Ratings. We had 3 key requests for this project:

  1. 10 unique stock picking strategies. Something for every investor
  2. 10 stocks per strategy updated daily
  3. MOST IMPORTANT: Provide stellar performance in ALL markets

And boy did he ever deliver!

In the webinar we go over full details on each of the 10 strategies and their market beating results.

No doubt you have heard many other investment experts talk about great results in theory, but come up short in reality.

That is why I came up with…

136,835 Reasons to Pay Attention to What Comes Next

Back in February 2021 I decided to put my money where my mouth was by investing my entire Roth IRA account in 2 of these “black box” stock picking strategies.

Since then, my account has significantly outpaced the market leading to a real life gain of $136,835.

The full proof of that, including screenshots from my Schwab account, are in the presentation.

Even better, I show you the precise methods I used…and how you can easily do the same to enjoy market topping results.

It’s all there in the presentation…so start watching now:

100 Best Stocks for October >

You owe it to yourself to get on the right foot for the rest of the year by watching this valuable presentation now so you can use these winning strategies to outperform in the months ahead.

But Time is Running Out!

So don’t delay, click below to watch now:

100 Best Stocks for October >

Wishing you a world of investment success!


Steve Reitmeister
…but everyone calls me Reity (pronounced “Righty”)
CEO, StockNews.com & Editor, Reitmeister Total Return


SPY shares were trading at $433.56 per share on Thursday afternoon, down $5.08 (-1.16%). Year-to-date, SPY has gained 14.63%, versus a % rise in the benchmark S&P 500 index during the same period.


About the Author

Steve is better known to the StockNews audience as “Reity”. Not only is he the CEO of the firm, but he also shares his 40 years of investment experience in the Reitmeister Total Return portfolio. Learn more about Reity’s background, along with links to his most recent articles and stock picks.

Stock Alert: Just Another BUY THE DIP Opportunity

Please enjoy this updated version of weekly commentary from the Reitmeister Total Return newsletter. Steve Reitmeister is the CEO of StockNews.com and Editor of the Reitmeister Total Return.Click Here to learn more about Reitmeister Total Return


SPY – Traders threw a tantrum after the Fed shared details on their rate hike plans. This has the S&P 500 (SPY) hitting the lowest level in quite a while. Gladly, things are not as dire as they seem. That is why Steve Reitmeister shares his latest insights to explain why a bull market is still in place…and how to target the best stocks and ETFs for the days ahead. Read on for the full story below…


The Fed was not kidding when they said “higher rates for longer”. That was reiterated with extra vigor on Wednesday….and investors were not pleased.

Does this change the bullish thesis? Or is this just a little detour south before the next leg north?

We will break it all down in today’s commentary.

Market Commentary

Here is the nutshell of the Wednesday Fed announcement.

The economy is doing better than we expected…so it’s going to take a bit longer to bring down inflation to target level…the good news is that we really believe we can do it without creating a recession.

So why did stocks go down on this seemingly positive outlook?

Because the dot plot of rate expectations by Fed officials now has the end of 2024 rate still way up at 5.1%. That was revised higher from the previous estimate of 4.6%.

Yes, this most certainly fits in with the Fed narrative of “higher rates for longer”, but much longer and higher than investors previously anticipated.

This notion of longer Fed involvement increases odds of overstaying their welcome creating a recession. Also it delays when rates are lowered which would be a catalyst for higher economic growth which begets higher earnings growth and higher stock prices.

Granted this update is not overly positive. But it’s not really negative either.

That’s because when you pull back and assess the big picture it still says that the odds of recession (and return to bear market) are very low. This is reinforced by Fed officials who now predict +1.5% GDP growth in 2024 up from previous projection of +1.1%.

To boil this all down…things are still bullish because odds of recession are so low. But the idea of when the Fed starts lowering rates to boost the economy and stock prices is also postponed.

Instead, I see slower earnings growth begetting more modest stock price increases for the overall market. For example, the S&P 500 (SPY) may only go up 5-10% next year. Not terrible…not exciting either.

But that 5-10% is the return for the average stock. Our goal is to invest in BETTER THAN AVERAGE stocks. Or to be totally honest, we want GREAT stocks.

Gladly that is easy to do thanks to our reliance on the consistent outperformance of the POWR Ratings. Focusing on the fundamentally most sound and reasonably priced stocks has always been a path to better returns.

In fact, historically many of my years of superior outperformance over the market is precisely this situation. Where superior stock selection handily beats mundane results for overall market.

So I welcome this chapter where every dip is just another opportunity to snap up the best stocks at even better prices.

How low could this recent dip go?

Moving Averages: 50 Day (yellow), 100 Day (orange), 200 Day (red)

We are enduring our first real test of the 100 day moving average (4,375) in quite some time as we broke below on Thursday. Maybe bounce back Friday…maybe take a real shot at scaring investors with a test down to the 200 day moving average at 4,189.

That would represent a stiff 10% correction for the overall market that could levy 50-100% more pain on riskier positions.

Honestly, I would welcome that move in the short run…because I know it would not be long lived. Also as a value investor I think that it would be fun to see all the overpriced glory stocks, that led the way the first half of the year, get their proper comeuppance now.

As shared earlier, I still see us in the midst of a long term bull market. However, investors were a bit too overzealous about when the Fed was going to lower rates…and thus a necessary pullback/correction is unfolding.

Maybe bottom is now at the 100 day moving average…but likely no worse than down at the 200 day moving average. Yet all that will truly do is get rid of recent excesses making it all the easier for the overall market to move higher by end of the year and into 2024.

Again, the key to outperformance is going to be superior stock selection. The next section will share with you some important insights on that front…

What To Do Next?

Discover my current portfolio of 7 stocks packed to the brim with the outperforming benefits found in our POWR Ratings model.

Plus I have added 4 ETFs that are all in sectors well positioned to outpace the market in the weeks and months ahead.

This is all based on my 43 years of investing experience seeing bull markets…bear markets…and everything between.

If you are curious to learn more, and want to see these 11 hand selected trades, then please click the link below to get started now.

Steve Reitmeister’s Trading Plan & Top Picks >

Wishing you a world of investment success!


SPY shares rose $0.10 (+0.02%) in after-hours trading Thursday. Year-to-date, SPY has gained 14.05%, versus a % rise in the benchmark S&P 500 index during the same period.


About the Author

Steve is better known to the StockNews audience as “Reity”. Not only is he the CEO of the firm, but he also shares his 40 years of investment experience in the Reitmeister Total Return portfolio. Learn more about Reity’s background, along with links to his most recent articles and stock picks.

Why Are Stocks Weak Again?

Please enjoy this updated version of weekly commentary from the Reitmeister Total Return newsletter. Steve Reitmeister is the CEO of StockNews.com and Editor of the Reitmeister Total Return.Click Here to learn more about Reitmeister Total Return


SPY – The fun of the 2023 bull rally is over. Now we are in a more volatile period where what happens next for the S&P 500 (SPY) is not so clear. That is why 43 year investment veteran Steve Reitmeister shares his latest market outlook, trading plan and top picks in this fresh commentary below…


My expectation of a trading range forming is playing out right on schedule. That being where resistance was found at 4,600 for the S&P 500 (SPY) which was simply too high after an overextended bull run.

On the other hand, there was no need for stocks to sell off more than 5%. Thus, support was found just above the 100 day moving average currently at 4,344.

Moving Averages: 50 Day (yellow), 100 Day (orange), 200 Day (red)

In a trading range scenario, the market is overly susceptible to each new headline. One day that blows bearish…and the very next day gloriously bullish.

In short, almost every move inside a trading range is meaningless noise. And thus should mostly be ignored.

That is because the VAST MAJORITY of the time, the market breaks out of the range in the same direction it was going before the range formed. In the current case that means we should break higher out of this range unless there is truly a threat to the bullish thesis.

That would require that the preponderance of the evidence starts to show that the odds of a recession have greatly increased. That is currently not true.

What is true is that we find that the recent economic data is a bit better than expected. Normally that is awesome news that has stocks spiking higher.

Unfortunately, that is not so awesome when the Fed is worried about lingering high inflation not fading away quickly enough. Simply stated…

The more robust the economy looks > the stickier high inflation becomes > the more likely the Fed raises rates even higher > the more they risk creating a recession instead of soft landing

Indeed, the recently improved economic picture has also increased the odds of a Fed rate hike at the November or December meetings. Just a month ago only 28% odds were placed another 25 basis point from the Fed. As for today that is now up to 46%. This again explains the stock market weakness this week.

Let me be clear…The improved data for ISM Services and Jobless Claims this week, that sparked the most recent sell off, does increase the odds of more rate hikes. But as Goldman Sachs predicts, the odds of a new recession forming in the next 12 months is still only around 25%. That means we are much more likely to have a soft landing which keeps the long term bullish thesis in place.

At this stage investors are likely going to react strongly to other upcoming economic events coming into the 9/20 Fed Rate decision. The roll call of reports includes:

9/13 Consumer Price Index

9/14 Producer Price Index, Retail Sales & Jobless Claims

9/20 Fed Rate

Note that right now most investors are expecting the Fed to hit the pause button on rates at this September 20th meeting. The key for investors is focusing on what Powell says at his press conference. That will provide their intentions for future meetings. Again, the odds for a rate increase in November or December is getting ever closer to 50%.

Trading Plan and Next Steps

Nobody knows when this trading range will end. But likely it will be before the holidays when the seasonal good tidings help to create a Santa Claus rally.

Thus, it is important look past the day to day fluctuations to appreciate that the long term picture is still bullish. This makes it wise to use meaningful dips in the range to buy the best looking stocks.

Which stocks are those?

More on that in the next section…

What To Do Next?

Discover my current portfolio of 7 stocks packed to the brim with the outperforming benefits found in our POWR Ratings model.

Plus, I have added 4 ETFs that are all in sectors well positioned to outpace the market in the weeks and months ahead.

This is all based on my 43 years of investing experience seeing bull markets…bear markets…and everything between.

If you are curious to learn more, and want to see these 11 hand selected trades, then please click the link below to get started now.

Steve Reitmeister’s Trading Plan & Top Picks >

Wishing you a world of investment success!


SPY shares were trading at $444.98 per share on Friday afternoon, up $0.13 (+0.03%). Year-to-date, SPY has gained 17.23%, versus a % rise in the benchmark S&P 500 index during the same period.


About the Author

Steve is better known to the StockNews audience as “Reity”. Not only is he the CEO of the firm, but he also shares his 40 years of investment experience in the Reitmeister Total Return portfolio. Learn more about Reity’s background, along with links to his most recent articles and stock picks.