
With millions of kids heading back to school in just weeks, investors may want to keep an eye on oversold retailers like Target Corp. (TGT).
Granted, Target hasn’t been popular among investors.
After all, the stock collapsed on an earnings miss. EPS came at $2.19, which was short of expectations. Revenue came at $25.17 billion. Analysts were expecting sales to come in at around $24.49 billion.
“Throughout the quarter, we faced unexpectedly high costs, driven by several factors, resulting in profitability that came in well below our expectations, and where we expect to operate over time,” Target Chief Executive Brian Cornell added.
It’s why the TGT stock plummeted from about $207 to a low of $140.
But the pullback has become overkill, creating a solid opportunity.
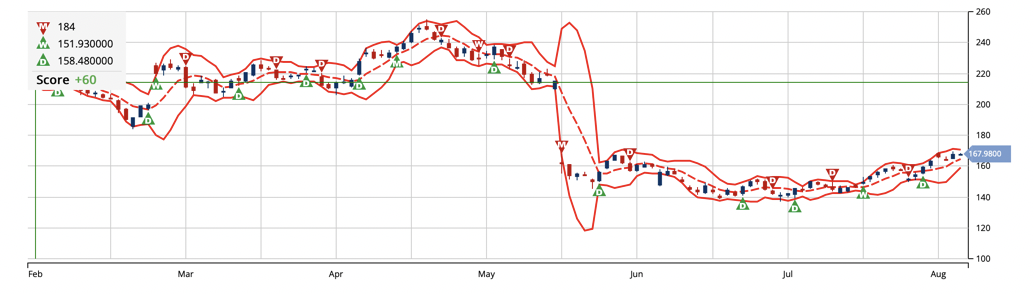
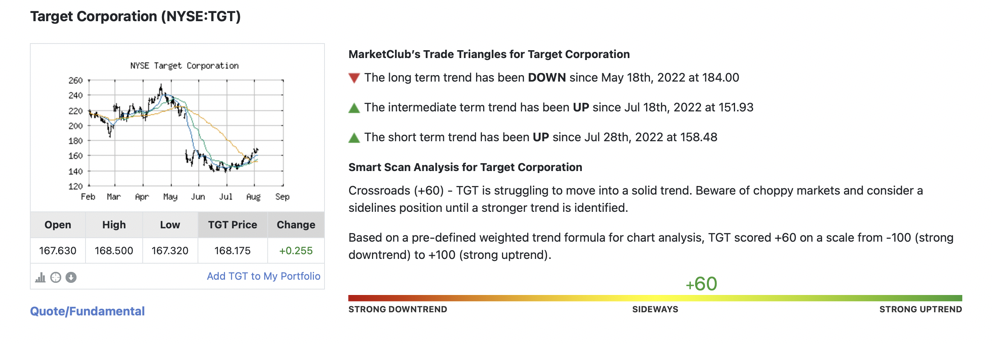
For one, according to the MarketClub tools, the intermediate and short-term trends are moving in the right direction. MarketClub is showing green weekly and daily Trade Triangles, which is an indication of further short term upside in the beaten-down retail stock. Continue reading "Chart Spotlight: Target Corp. (TGT)"