
Each week Lo ngleaftrading.com will be providing us a chart of the week as analyzed by a member of their team. We hope that you enjoy and learn from this new feature.
Weekly Gold Report (9-17 though 9-21)
Last week brought the final piece of news that the Gold Market needed to not only continue a campaign higher, but also to put the “Gold Bugs” comfortably in the drivers seat. For anyone that trades, owns, or simply follows the price of Gold, the FOMC announcement to bring back Quantitative Easing was very big news.
In short, the FED decided to reinstitute a plan that will involve printing more US Dollars and purchasing debt. They recognized that since late February when QE2 was halted, overall market sentiment had gone cold. The job market has suffered, the real estate and mortgage market has gone flat, overall market sentiment has not improved, and this has left major markets dangerously low in volume.
While most investors recognize the fact that each round of Quantitative Easing will likely come back to haunt them at a later date, the FED’s new commitment to the market should keep things underpinned for a while. History has shown that when the FED is devaluing the US Dollar that most major markets, including the Precious Metals, will rally. Traders and investors should look for small pullbacks to buy or add to their long position in Gold.
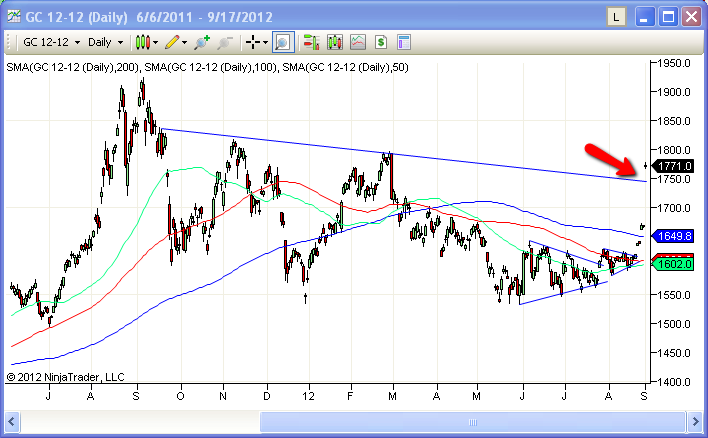
I anticipate that this week will bring more new buyers to the Gold. It was expected that prices would get a bit choppy after last week’s strong rally, but also understood that the short pullbacks will be quickly bought. I believe that the most cautious traders will look for a retest of the dominant trendline across prior tops to scale in. This trendline comes in on the daily chart (see chart) of the December Futures at $1750. The more aggressive traders will likely look to add to their positions as early as this Monday morning no matter what the price shows.
While I do not expect the Precious Metals to return to the parabolic movement we saw during the early part of QE2, I do think we will see a steady move higher in the Metals. This should continue until we are closer to the Presidential Election in the United States. In the past, the Gold has shown that it will target higher prices in $25 increments. With this in mind, I will look for a retest this week of the February high price near $1800 and possibly $1825 by the end of the week.
Good luck this week in the markets. And please feel free to call or email my office. As a Senior Market Strategist with Long Leaf Trading, I advise customers in the futures markets and welcome any input from fellow traders. I can be reached toll free at (888) 272-6926 or by email at [email protected]
Thank you for your interest,
Brian Booth
Senior Market Strategist
888.272.6926
QE has opened the floodgates of GOLD.
UP, UP and Away......
GOLD 2000. for the New Year.
GOLD stocastics are BULLISHLY fully embbed on the daily chares, but September usually gets nasty toward the latter period of the month. So a correction is due shortly - if not started at 1780. yesterday.
Yes, last year in September the Precious Metals did drop in the later part of the month. This year however, I will continue to recommend executing buys on dips until the market suggest otherwise. I am beginning to wonder why 90% of the comments on this Weekly Gold Chart have been traders trying to slam a bullish outlook. Granted, they are much less each week since I began recommending bullish strategies over the last eight weeks. Are there any other traders out there that are bullish Gold with me? Perhaps they just don't write in when they are right. That must be it.