
True Fibs for E-mini Futures Trading
Introduced by Burt Schlichter
We addressed the topic of Fibs and Fibonacci in a previous article, “Fibonacci Made Simple.” If you are not familiar with the man or the mathematics, I do encourage casual research as Fibs can be successfully used for confirmation and/or projection when properly applied. A word of caution, Fibonacci Retracements and Extensions should always be used in conjunction with other indicators or methodologies. As a standalone tool, its subjective nature simply leaves too many questions unanswered.
There is no question of the elegance and even precision with which these levels can be viewed after the fact. The most common levels are observed by a great number of traders and on larger time frames. It is easy to see the hive mind at work which begs the philosophical question of “predictive tool or self-fulfilling prophecy?” Either way, as long as we are armed with the caveats previously stated and able to potentially enhance our trading performance through its use, let’s go Fibbing.
Fibonacci Retracements
In an uptrend, the basic idea is to be a buyer in the market as price pulls back to a Fib Support level. Most charting platforms have a Fib Retracement Tool built in. Fibs are like trend lines — you can draw them all day, as many as you want and they are absolutely free. All one needs to do is clearly identify a significant swing high and a significant swing low. Many charting platforms also include an indicator that will identify major swings for those who are new to trading. Keep in mind, this indicator prints several bars after the actual high or low based on the default “look-back” period, which in most cases, can also be tweaked to best suit the time frame and market you are trading. If the swing high or low is exceeded, the indicator will recalculate and mark your chart accordingly.
The types of charts you use are volume, price, time, range, and tick. They are all acceptable and will provide you with the same Fib Retracement Levels as long as you are using the same swing high and swing low price. In the example below, we are using a volume based chart. In the up-trending example, we simply click the swing low and drag our cursor to the swing high and release our mouse button.
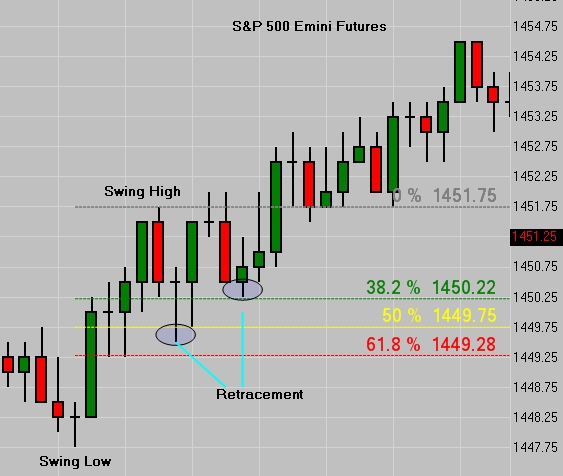
(ES) SP500 Fib Levels
We drew from the swing low at 1447.75 up to the then current swing high at 1451.75. There was no way to know for sure that 1451.75 would be the swing high, but with each candle that closes higher, you simply continue to measure until you reach a level where you get a minimum 38% retracement. In this example, price pulled back initially to 1449.50 which was the midpoint between the 50% and 61.8% retracement. On a smaller move such as this one, the difference between the 50% and 61.8% was only 2 ticks. This is an “area” and quite suitable for our example.
Price makes an initial bounce back to the previous swing high. It retraces again, this time to the 38% level which is also an “area” as the new swing high is 1 tick higher. Price ultimately rallies to 1454.50. Entering this trade at the 50% level would have resulted in very little draw down and a 5 point move. On larger time frames, the distance between levels can be relatively significant and can lead to greater risk. Even though we purposely chose a “good example”, we have to ask ourselves what our risk would be if price had not reversed upwards at 1449.50. If we entered on “blind faith”, our stop would have needed to be either just below the 61.8% level or preferably just below the swing low itself.
Remember, we are looking at a historical chart here. Once the market has moved on, it is much easier to come back and identify these areas. If you want to add Fibs to your daily toolbox then you will need to learn to utilize them while the market is moving. This takes practice, but as with all things trading, patience is required. Again, with the benefit of hindsight, we were able to select an example that exemplifies a positive “textbook” outcome. Before we move to a less than perfect example, I want to show you the same chart with some additional information.
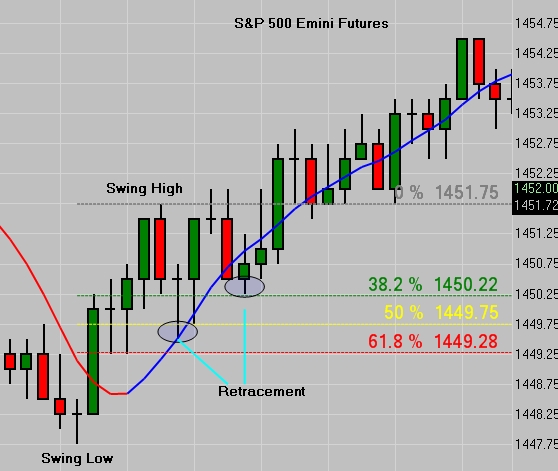
(ES) Fib Levels + CF_MA1
Notice on the second chart where the low of our entry candle is. Even though the reversal came between the Fib levels, the CF_MA1 nailed the entry to the tick. Is that by accident? Not quite. While Leonardo da Pisa has achieved a Rock Star status within the world of trading, math is math. Keep in mind, he didn’t invent Fibs; he discovered a principle that had been in play since the foundation of the earth. Do the research as suggested and you will discover Leonardo’s discovery was based on the copious copulation habits of rabbits.
Let’s look at a not so perfect example.
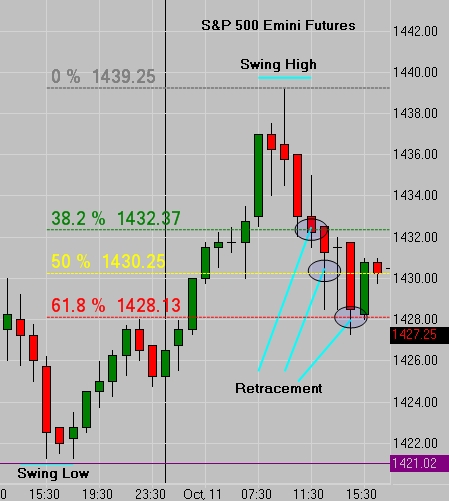
(ES) Fibs Hourly Chart
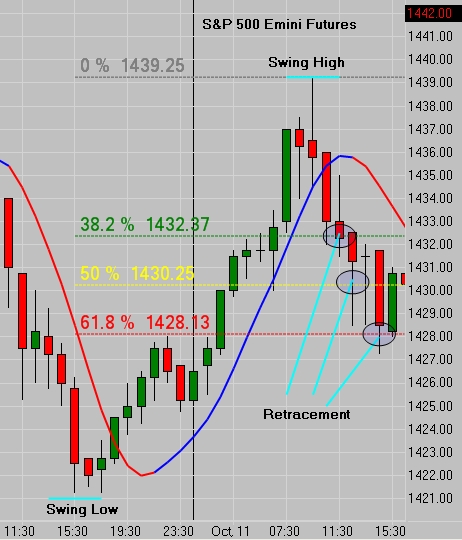
In this example, we use the swing low at 1421.25 and the swing high at 1439.25. The first pullback was to the 38% level at 1432.37. Because the ES trades in 1/4 point increments, or “ticks”, we have to round that price up to 1432.50 or down to 1432.25. Either way, the 38% level failed to hold. There was 1.5 point bounce, but keep in mind this is now an hourly chart. The 50% level at 1430.25 also failed to hold. The final level at 61.8%, or 1428.13, appears to be holding… Did it? Let’s see:
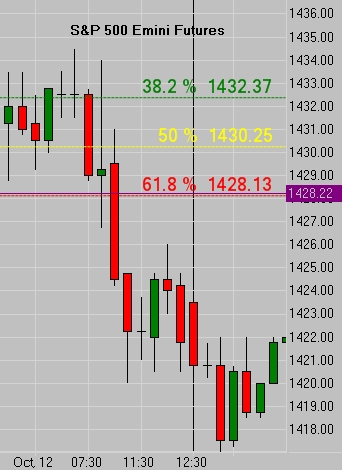
(ES) Fibs Behaving Badly
Sometimes they hold, sometimes they don’t. This is not to discount their effectiveness; this is to show why Fibs should only be part of a comprehensive trading plan. Let’s look at the same chart again through a slightly different lens.
(ES) Hourly Fibs + CF_MA1
Using our indicator set and methodology, we would not have been a buyer here. In fact, the first red candle which closed at 1433 based on this chart setup would have been an alert for us to consider entering a short position and/or exiting any long position we might have been in. The other option for someone who has a strong attraction to Fibonacci would be to simply remain flat. No position is also a valid position.
In Part 2 of this article we will observe a down trending market. In Part 3 we will address Fibonacci Extensions. Until then, work hard - trade safe - live the dream!
Written by DeWayne Reeves of CFRN.net. Burton Schlichter is a partner and featured broker at CFRN.net.
Learn to Trade the E-mini S&P 500
Learn to Trade the E-Mini S&P 500 as well as other futures markets in a live trading environment with professional traders. Test drive the online platform for a full week with the Christian Financial Radio Network (CFRN). These virtual classes are led by seasoned traders whose guidance and experience will allow you to grow in an educational setting. By the end of the course, you will be taught to look for helpful indicators that may improve your trading strategies. This is live training in live markets. Get started now!
CFRN Trade Room provides a nurturing environment to learn to trade and they have developed their own indicator set, which allows the members to adjust to current market conditions! They offer a free trial and they have a public access room that is always available as well.
Anyone have experience with this CFRN trading room?