
Each Week Longleaftrading.com will be providing us a chart of the week as analyzed by a member of their team. We hope that you enjoy and learn from this new feature.
This week’s focus turns to the May 2014 Natural Gas futures (NYMEX:NG.K14.E), where the transition into spring seasonality and warmer weather has weighed down demand outlook. Over the winter months, we had continually seen larger than expected draws from Natural Gas supplies due to extreme winter conditions, but as US weather forecasts continue toward warmer levels, it appears the threat to already tight near-term supplies is diminishing.
Since reaching a high print of 4.893 a few weeks ago on February 24, 2014, May Natural Gas has taken a slight leg lower and consolidated over the past few weeks as it decides where it will head next. The Commitments of Traders report as of March 4th has shown traders have gone from a net long to a net short position on Natural Gas, which hints that the recent strong up-trend may be losing steam. In the near-term, I would agree with this negative bias, and look for a correction in the Natural Gas market.
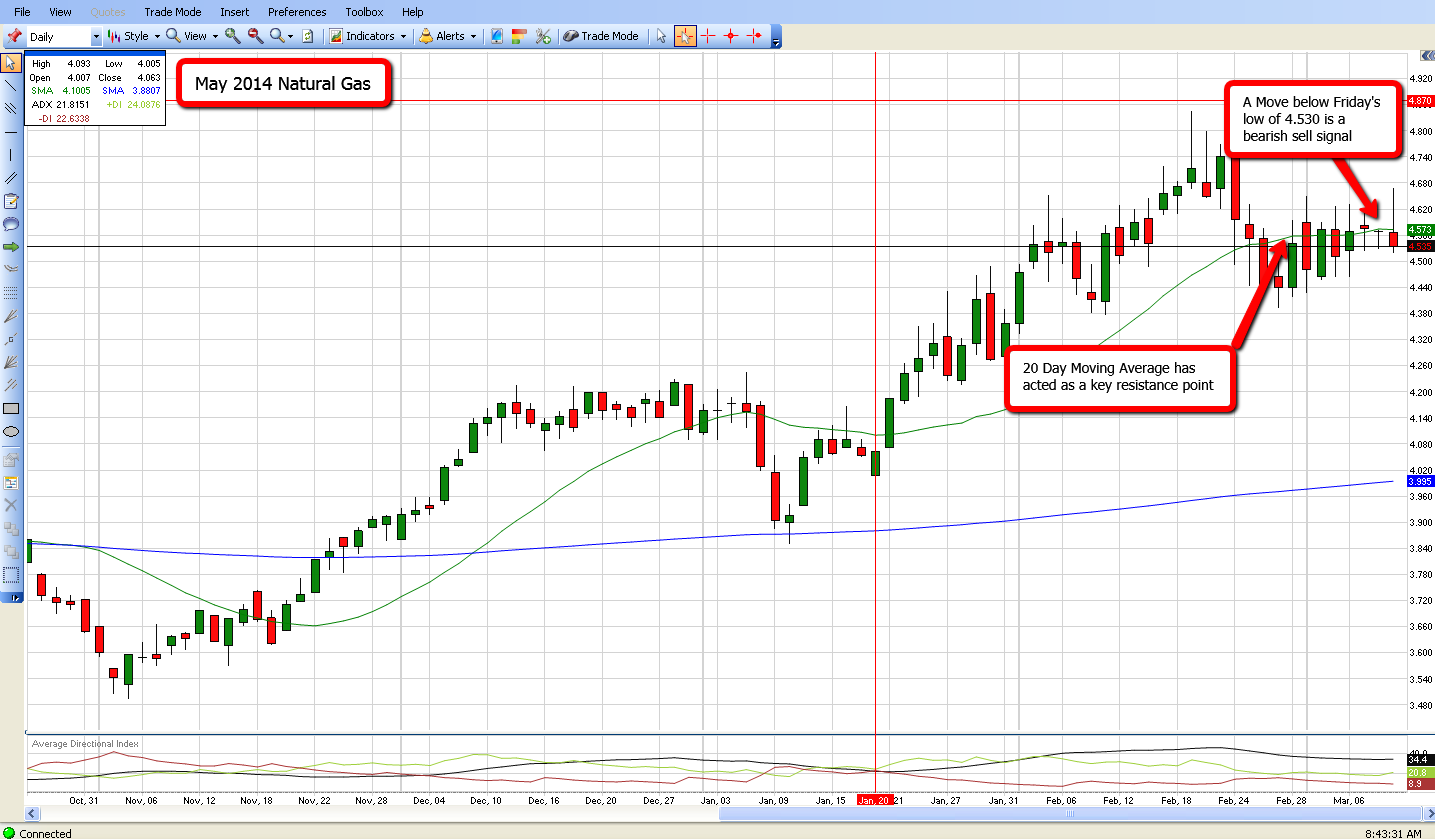
For a swing trade, I would be a seller as the market moves below Friday’s low of 4.530. My near-term target would be the swing low of 4.393. This position would allow you to use the 20 day moving average as a resistance point, as this indicator has kept the market in check during the recent consolidation period.
I advise clients on trading futures and futures options markets on a day to day basis. If you have any questions regarding this chart or questions regarding trading futures and futures options, feel free to call me directly at 888-272-6926.
Thank you for your interest,
James Leeney
Account Executive
Phone: (888) 272-6926
www.longleaftrading.com
** There is a substantial risk of loss in trading futures and options. Past performance is not indicative of future results. The information and data contained in this article was obtained from sources considered reliable. Their accuracy or completeness is not guaranteed. Information provided in this article is not to be deemed as an offer or solicitation with respect to the sale or purchase of any securities or commodities. Any decision to purchase or sell as a result of the opinions expressed in this article will be the full responsibility of the person authorizing such transaction.
When the super cold weather first hit, say 6 weeks ago, NG was in massive backwardization, running up to just over $5 with distant months still in the very low 4's. I see now that out months have come up to meet "current" prices. So there are two possible but different conclusions: Either NG has become a new shiny object in terms of speculation and bulls have spread bets way out there as far as the eye can see....OR, the traditional seasonals will apply and demand will shrink as the weather warms up. I happen to be betting on the latter but I have no way to predict which outcome will result. Truth is, BOTH scenarios could result. If the amounts in storage start pumping back up, it would be nominal to suspect that the long speculators will take their bets off. And, if one or more of those reports come out showing huge surpluses, then NG could experience some dramatic downwards spikes. I doubt NG retreats back into the 3's, but nobody can predict the future. NG itself is potentially in massive surplus but the infrastructure to get it to market is unquestionably the thing preventing a price collapse, IMO.
It sure looks like a potential place to sell. But with China's poor economic report today (3/10/14) and nat gas maintains its price level, and the fact that LNG is still getting top dollar in Japan, S.Korea, China, I'd have to wonder about that coming dip. Maybe, NG is building a base for further demand... But the NG COT report has indeed peaked so we should see a drop, but I bet it holds $4 and a 1/4 and cranks higher.