Chart of The Week - Natural Gas

Each Week Longleaftrading.com will be providing us a chart of the week as analyzed by a member of their team. We hope that you enjoy and learn from this new feature.

To start the week, we will be watching Natural Gas futures closely. July Natural Gas saw a spike higher overnight to $4.89, but gave back those gains in the early morning hours. There is a measure of support in the market as Russia has halted Natural Gas flows to the Ukraine. Along with halted Natural Gas flows to the Uklraine, the US Natural Gas storage remains tight and sits well below the 5 year average. With a warmer weather outlook across the US, the case can be made for a bullish week in Natural Gas.

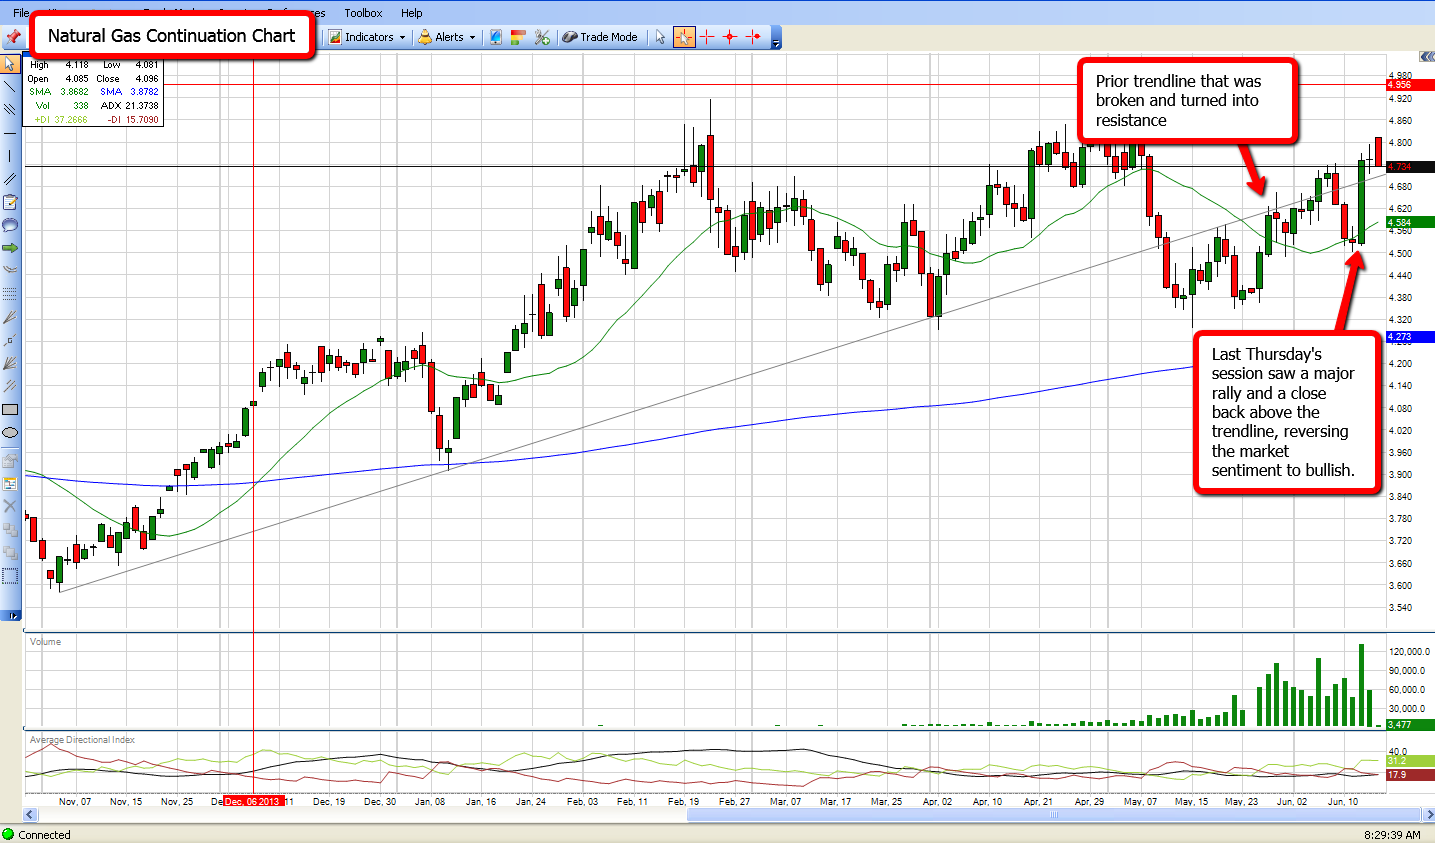
On the technical side, Natural Gas has sold off to a critical area of support at $4.70. This bullish trend-line was broken in mid-May and since become resistance in the market. After last week’s EIA inventory report on Thursday morning, the market spiked back above this trend-line with closes above it on both Thursday and Friday. In today’s session, Continue reading "Chart of The Week - Natural Gas"

Chart of The Week - Natural Gas

Each Week Longleaftrading.com will be providing us a chart of the week as analyzed by a member of their team. We hope that you enjoy and learn from this new feature.

This week’s focus turns to the May 2014 Natural Gas futures (NYMEX:NG.K14.E), where the transition into spring seasonality and warmer weather has weighed down demand outlook. Over the winter months, we had continually seen larger than expected draws from Natural Gas supplies due to extreme winter conditions, but as US weather forecasts continue toward warmer levels, it appears the threat to already tight near-term supplies is diminishing.

Since reaching a high print of 4.893 a few weeks ago on February 24, 2014, May Natural Gas has taken a slight leg lower and consolidated over the past few weeks as it decides where it will head next. The Commitments of Traders report as of March 4th has shown traders have gone from a net long to a net short position on Natural Gas, which hints that the recent strong up-trend may be losing steam. In the near-term, I would agree with this negative bias, and look for a correction in the Natural Gas market.

For a swing trade, I would be a seller as the market moves below Friday’s low of 4.530. My near-term target would be the swing low of 4.393. This position would allow you to use the 20 day moving average as a resistance point, as this indicator has kept the market in check during the recent consolidation period. Continue reading "Chart of The Week - Natural Gas"

Chart of The Week - Natural Gas

Each Week Longleaftrading.com will be providing us a chart of the week as analyzed by a member of their team. We hope that you enjoy and learn from this new feature.

This week's focus turns to the March Natural Gas futures, where strong price action stemming from bullish fundamental data gives way to a possible buying continuation. Total Natural Gas storage stands at 1.686 bcf, or 27% below the 5-year average. This draw in supply has been aided by recent extreme cold temperatures across the United States.

After posting a recent swing low of 4.563 last week on Monday, February 10, 2014, the market has experienced a sharp climb in prices. Last week, we also saw the 20 day moving average act as support for the bullish market on multiple occasions, making this indicator a key support level in a swing trade opportunity.

As we start this week, we have seen yet another push up to the 5.400 level, indicating the Natural Gas market still holds a bullish sentiment. Continue reading "Chart of The Week - Natural Gas"

Chart to Watch - Natural Gas

We've asked our friend Jim Robinson of profittrading.com to provide his expert analysis of charts to our readers. Each week he'll be analyzing a different chart using the Trade Triangles and his experience.

Today he is going to take a look at the technical picture of the December Natural Gas Futures (NYMEX:NG.Z13.E).

I hope you are having a GREAT week !

This week we will take a look at December Natural Gas.

When trading futures with the MarketClub system we use the weekly Trade Triangles for the trend and the daily Trade Triangles to time the entries and exits.

Natural Gas has put in a green weekly MarketClub Trade Triangle and has put in a red daily MarketClub red Trade Triangle. Continue reading "Chart to Watch - Natural Gas"