
Hello MarketClub members everywhere!
Well, here we are, the 1st of April and I don't have an April fools joke to share with you. Q1 will go down in history as one of the best first quarters since the 1930s. So what propelled this market to push so much on the upside in Q1? To be honest with you I'm not sure; maybe it was the prospect of ongoing cheap money from the FED or something else. When you look at hedge fund managers and other professional traders, nobody was expecting such a strong quarter. Now that Q1 is in the record books it is time to start looking at what is ahead for this the stock market.
In today's video, I will be analyzing crude oil (NYMEX:CL.K16.E), which triggered a sell signal and Tesla Motors Inc. (NASDAQ:TSLA) which triggered a buy signal today. I will also be covering the usual suspects.
Indices
Last week's Closes:
DOW (INDEX:DJI): 17,515
S&P 500 (CME:SP500): 2035.94
NASDAQ (NASDAQ:COMP): 4771.93
I expect to see the indices to trade more like a two-way street and not move straight up in Q2. At the end of every week I look at the weekly charts to see where the indices are compared to the close last week, has the market gained or lost ground or moved over key levels. The DOW has been down over 100 points today and is now pretty much flat. How it closes for the day is pretty much anyone's guess at this point.
There is a battle royal going on between the Bulls and the Bears right now. Who wins, is yet to be decided. Key levels to watch in April for the indices are as follows:
DOW (INDEX:DJI): 17,791
S&P 500 (CME:SP500): 2073
NASDAQ (NASDAQ:COMP): 4900
If those levels are breached, it will trigger green monthly Trade Triangles, indicating a positive upward trend.
Crude Oil
Last week's Close: Cruce Oil (NYMEX:CL.K16.E): 39.48
Crude oil triggered a sell signal yesterday and we are seeing further downside action today. On March 23 the daily Trade Triangles gave a signal to exit any long positions at $40.41. This proved to be a timely exit as the market is currently trading at $36.86. Yesterday's sell signal in came in at $37.71 which is a number I have highlighted in previous videos. I would not be surprised to see the May contract trade down to $35.50 in the future.
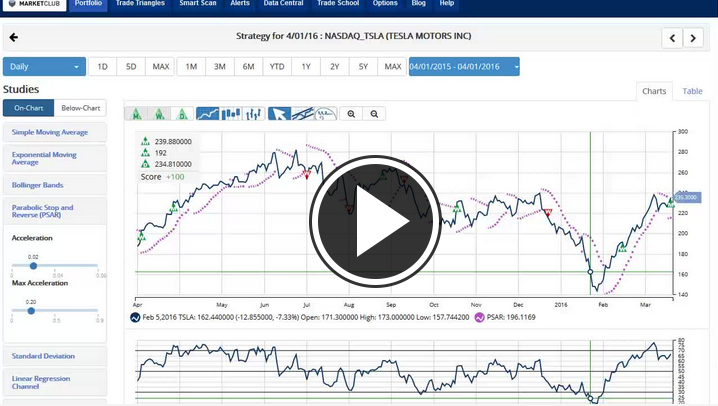
Tesla Motors Inc.
Last week's Close: Tesla Motors Inc. (NASDAQ:TSLA): 227.74
Yesterday, the amazing Elon Musk who is the head of Tesla unveiled to much fanfare their model 3 car that he proposes to sell for $35,000. This would put Tesla in a more affordable range for most car buyers. The response was outstanding with 150,000 people plunking down $1,000 for the rights to buy a Tesla Model 3 car. Today, Tesla triggered a green monthly Trade Triangle at $239.88 indicating that the major trend is now positive for this stock. My upside target for Tesla is $280.
Gold
Last week's Close: Gold (NYMEX:GC.M16.E): 1,223.20
Gold triggered a red daily Trade Triangle at 1217 on the June contract indicating a move to the downside. Both the weekly and daily Trade Triangles red and only the monthly Trade Triangle remains green. A move below 1207 would complete a top and a potential Fibonacci retracement down to the 1150 area. This same area, give or take a few dollars is also the measurement from the head and shoulders top that would be confirmed with a move below 1207. Watch the 1207 level very closely.
Stay focused and disciplined.
Every success with MarketClub,
Adam Hewison
President, INO.com
Co-Creator, MarketClub
Hi Adam, on March 7 I posted the following comment on the double bottom of the daily chart of the DOW. It reads as follows:
Konrad Wassenaar says:
March 7, 2016 at 3:54 pm
Hi Adam, thank you for your very informative articles that you so freely share with the general public.
I would like to make a comment on the double bottom displayed on the DOW daily chart, where it shows that the price might run into some resistance at current levels.
However when we look at the weekly chart or the monthly chart we also have a double bottom on both, where the indication is that the DOW could go as high as 20500 for the weekly chart or 20570 for the monthly chart. Should we take this in consideration or ignore it until we see a confirmed break above the daily resistance level. I am looking forward to your comment.
Kind regards
Konrad
AS we now are experiencing a remarkable rally, is there some value in looking at the weekly and monthly charts as well to see if a double bottom has shown up too?
I am looking forward to your comments and others' as well
Kind regards
Konrad
I guess you should have waited a couple hours before making your video.
Looks like it is off to the moon again on magic fed juice.
Just after Enjoying Relief rallies, and achieving some Technical bounce backs, Gold Crude and even Stocks ones again turned towards their original Down trend cycle.
No need to evaluate any more concerned data or no requirement to consider reason thereof. This happened, very simply because of "Long Term Bear face" is not finished yet, so we may find some fresh new bottoms, which remained pending.
Accordingly, bellow $ 1185 Gold and bellow $ 33 Crude Oil will deliver some more lower marks. Considering Time Study, till near about August 2016, it will be quite hard to get any sustainable Bull Run.
Over and above that, as far as Currencies are concerned, i think, there will be a heavy and sudden Up- Downs are assumed in all major currencies.