

MarketClub is known for our "Trade Triangle" technology. However, if you have used other technical analysis indicators previously, you can use a combination of the studies and other techniques in conjunction with the "Trade Triangles" to further confirm trends.
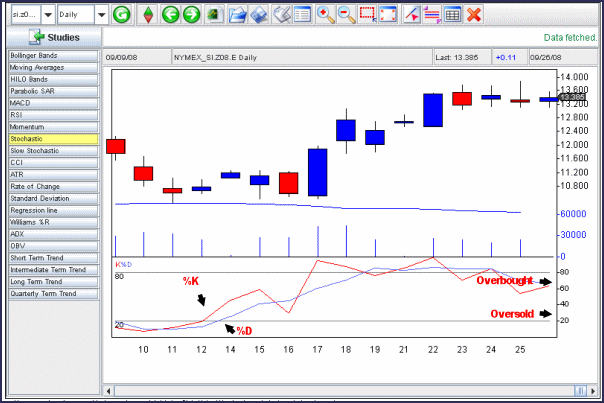
The stochastics indicator created by George Lane measures the relative position of the closing price within a given time interval. This indicator is based upon the premise that prices tend to close near the upper portion of a trading range during uptrends and near the lower portion of a trading range during downtrends. When prices close in the middle of a range, this suggests a sideways market. There are two components to this calculation, the %K value and the %D value. The %K is calculated as follows: %K= (C-Ln / Hn – Ln) x 100 where C = closing price of current period, Ln = lowest low during n time periods. Hn = highest high during n time periods and n = number of periods.
The %D value is the moving average of the %K value. The simple moving average calculation is: %D = 100 (Hn / Ln) also in the %K formula.
These formulas produce two lines that oscillate between a scale of 0 and 100. As with the other oscillators, a stochastic value below 30% suggest an oversold condition, while a value greater than 70% suggests an overbought condition.
Some simple trading rules apply in the use of the stochastics indicator. A sell rule would be to sell when the fast (%K) crosses over the slow (%D) and both are pointing down, but are still above the 70% level. A buy signal would be triggered when the fast crosses the slow, and both point up, but are below the 30% level.
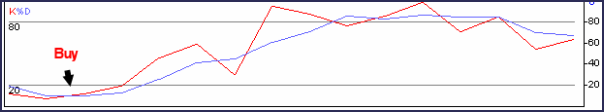
Another type of signal occurs when the stochastics indicator diverges from a price move similar to momentum and RSI.
---
 You can learn more about the Stochastics and George Lane by visiting INO TV.
I am looking for slow stochastics for NinjaTrader
Mr. Hewison: Given: There are full, fast, and slow stochastics. When setting up his charts, this novice trader would like to know what would determine the respective use of each of the above? Is it a certain time frame, or what? Thanks for your help.
IzeHavitt,
Thank you for your feedback. It depends on what kind of trader you are. If you are a long term trader you want to use the slow stochastic indicator if you're more of a short-term swing trader then you might find that the fast stochastic is a better tool for you to use.
I hope this addresses and answers your question.
All the best,
Adam
A great tool to use is the parabolic overlayed on a daily chart, with a MACD as an additional study but attaced to the chart. It shows a great change in trends.
I think it would be really great to add in which makret conditions inidcators work well in these teaser posts for indicators. The stochastics, as 4xShark mentioned, can stay overbought and oversold for long periods of time in trending markets. This makes the stochastics much more useful in range bound markets
Only problem I have with Stochastic indicator, cannot be use by itself. You have to Complimented with some other indicator. why? Because, prize tend to move the most when the indicator is in oversold or overbought Area and prize can stay for months in oversold or overbought area. You have to be careful not to sell or buy prematurely or exit prematurely I like to use MACD with Stochastic and LOOK for divergence. Thank you for another good post.
market club must recomend with prices when aclient must buy or sell a stock an equite or forex.