
Amey from The Wild Investor has been a rather frequent guest blogger (see previous posts) and for good reason...he knows what he's talking about! Over the weekend he and I were talking about technical indicators and I broke down and told him I know "less then nothing about Bollinger Bands". He laughed and broke them down for me, and afterwards I told him to write a guest blog so YOU could learn about them as well! Enjoy the article, feel free to comment with your insights, and visit The Wild Investor and SpeakStocks.com.
=====================================================================
One reason I prefer technical over fundamental analysis is that it is more visually appealing. By quickly glancing at a stock’s chart, I can tell whether I want to buy it, sell it, or what the price targets are.
I look at stock trading as an art, and like any craft we must constantly tweak and perfect it to achieve the most optimal outcome. As a die-hard user of technical analysis, I am always trying out different indicators, seeing which ones work for my trading strategy, and dropping the ones that do not. I typically like to keep my charts clean; otherwise, I get lost and lose focus.
Note: Before utilizing any new indicators or patterns within your real-time trading strategy, be sure to have tested the signals you generate from this new analysis. You can do this by either using a back-testing software or just simple manual tracking of stock prices based on your analysis.
The analysis tools I want to share with you today are called Bollinger Bands. They are essentially used to measure volatility of a certain security relative towards previous trends. Generally they appear as an overlay to your chart, and trace the current range of the stock.
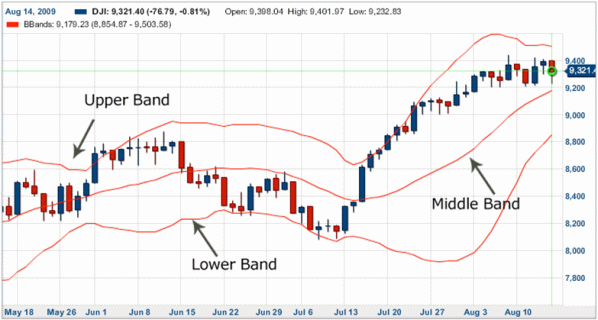
Bollinger Bands consists of 3 parts (all lines):
• The middle band, which is a simple moving average of a period of you specify. Usually 20
• The upper band, which is your period + N standard deviations. Usually 20 + 2 STD
• The lower band, which is your period – N standard deviations. Usually 20 – 2 STD
Typically the default value is usually a simple moving average period of 20 with a standard deviation of 2. For those none statisticians, 2 standard deviations cover about 95% of the range. Obviously, you can always tweak those numbers to match your trading strategy. Some traders even use exponential moving averages.
Just like any indicator the use of Bollinger Bands can be ambiguous. That is why it is important to test your conclusions before taking them to the real stage; however, the main purpose of these bands are to help you decide when a stock is at the high or low level of its average trading range. That being said, some people interpret the simple signals of selling when the price hits the upper band and buying when hitting the lower band. While that may work, you can probably get more accurate results when you use other indicators and factors (i.e. RSI, patterns) to confirm the move.
The key is to remember that Bollinger Bands measures volatility. During periods of low volatility, bands are narrow, and at periods of high volatility bands are obviously wider. You will also notice that these lines seem to act as support and resistance every now and then.
In the sample chart below, you will notice how the Bollinger Bands are narrow during June and then become wider in July, once the stock spikes higher. Finally, you can see that, in August, the bands are starting to become narrower, which could mean that the price will be flattening out and the previous upward trend push could be over.
So if you are looking for some indicator or overlay to measure the overall volatility of a security, then check our Bollinger Bands. They may seem confusing, but, once you actually see them in action yourself, they can blend very nicely into your trading strategy.
It appears to me that Mr. Cassidy's comments and therefore his conclusions are wrong. Sideways movement does not indicate certainty, as a matter of fact it indicates uncertainty in the direction of price and as a result the bands and volatility contract. When the bands widen it indicates certainty in the direction of the price and that's why the participants in the market all get on the same side of the market and move the price in an up or down direction or as we know it a trend.
Hi Amey,
Amey your lesson have really improved my knowledge about Bollinger Bands,i like using it to trade but i never really understood how it actally works,but now i can use it to analyse trade and figure out signals better than i used to do.thanks for the lesson.
Wayah.
Your assumption that the 2SD bands contain 95% of the data applies only if it is correct to assume a Gaussian (bell curve, Normal) distribution of the data. It is only approximately correct if you assume the data is unimodal and symmetrical. However it is true that for any data distribution that 2SD boundaries contain more than 75% of all the data according to Chebychef's Inequality (also spelled Tchebychef). See ASTM STP-11 on "Statistical Presentation of Data". Furthermore 3SD boundaries contain "more than" 89.9999%, and 4SD 93.75%. For the record, in a Normal distribution 1SD boundaries contains 68% of the data but for an unknown distribution is indeterminate.
As I have previously stated it is comforting to buy at the 50 day 2SD lower boundary knowing that (assuming symmetry) that 88% of those who bought in the previous 50 trading days paid more than you.
As the band width narrows it indicates increasing confidence that the item is correctly priced and, as you stated, widely diverging boundaries indicates uncertainty about the price, hence volatilty.
Hi Amey,
Thank you, that was a great article! I love bollinger bands too. I especially like the fact that they close up to warn you of future price action. I just wanted to add that some traders add another channel, ema or sma. It helps them stay in the trend when they can see that the tradings is contained within a narrow channel.
Here's a link from investopedia: http://www.investopedia.com/articles/trading/05/022205.asp
Thanks again,
Dan