
 The RSI can be an essential tool in a traders arsenal when used correctly. The problem is that there are a million trading styles and there is no one, single way to use an indicator. So what works best for you? In our quest to bring you tips and tricks from some of the best traders of all facets of trading we have invited Mark Hodge, Head Trading Coach at Rockwell Trading as a guest today. Mark is going to share how he uses the RSI, and if you have a similar trading style it could have a profound impact on your trading.
---------------------------------------------------------------------------------------------------------------------------------------------------------------
RSI is an indicator that is often used to identify overbought and oversold conditions when trading. Unfortunately, most traders use this indicator too literally, and miss out on some of the biggest trends. In this article I will introduce how RSI is typically used, and share a different way to use this indicator that could have a significant impact on your trading.
The Relative Strength Index, or RSI, is a popular indicator developed by Welles Wilder, and was first introduced in the book New Concepts in Technical Trading Systems. RSI is a momentum indicator used to measure changes between higher and lower closing prices.
RSI is plotted between 0 and 100. Wilder considered readings below 30 to be oversold, and readings above 70 overbought. At face value, overbought conditions are usually ripe for a pullback, while oversold conditions can be used to identify buying opportunities.
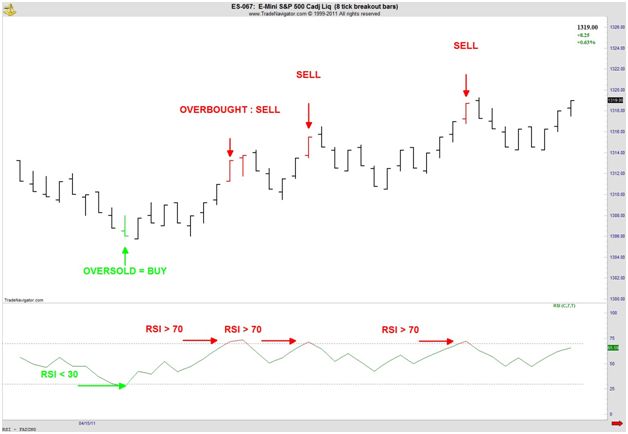
To identify these conditions on a chart, I’ve highlighted bars green when RSI is below 30 (oversold), and red when RSI is above 70 (overbought). At first glance, buying oversold conditions and selling overbought conditions looks like a great way to trade a market. Conservative traders will typically wait for RSI to drop back below 70 before going short, or above 30 before going long.
This method might be a great way to trade choppy or sideways market conditions, but in trending markets, traders often miss great moves. Or even worse, traders might find themselves on the wrong side of the trend. Because of this, I use RSI in a much different way.
Working with RSI, I discovered a curious thing: RSI remains overbought or oversold in the strongest trends! Let’s look at a chart.
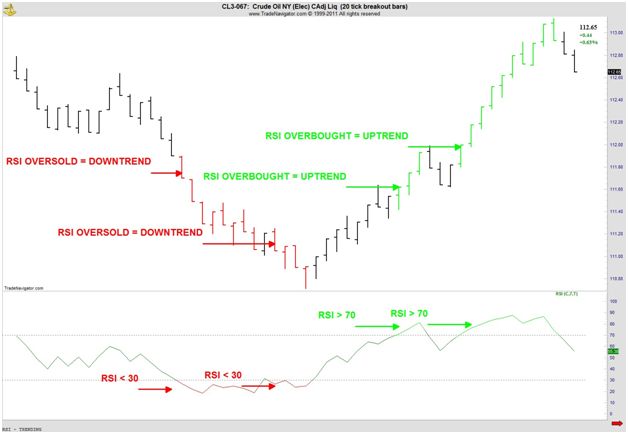
In the chart above, RSI readings below 30 are colored red, while readings above 70 are colored green. You will notice that in trending markets, RSI will remain overbought or oversold for a prolonged period of time.
How can we use this to our advantage? By looking for RSI to be overbought or oversold when looking for trends!
With my trading I actually use RSI to confirm a trend whenever I am trading trend following strategies. In fact, this is one of my trading rules, one that usually keeps me out of weaker moves.
3 things to consider:
1) The default setting for RSI is typically 14. As a day trader, and to get better signals when using RSI for trends, I prefer a 7 period setting.
2) I do not use RSI as the sole indicator for making trading decisions. I personally find that a second indicator is important for determining market direction. At Rockwell Trading, our strategies rely on MACD and Bollinger Bands in addition to RSI. We find that these indicators are a nice compliment to RSI, especially when using this indicator to confirm a trend.
3) In my experience, this concept is most effective for day trading. As with any indicator or method, it’s important to do your own due diligence and test a concept before risking money on a trading idea that is new to you.
Take a look at RSI oversold and overbought conditions and consider combining RSI with your favorite indicator(s). You might be surprised at just how powerful RSI is for identifying the strongest trends in the markets you trade.
Best,
Mark Hodge
Head Coach
Rockwell Trading
Mark is a trader and Head Coach at Rockwell Trading. If you would like to learn more about day trading, click here to get your free copy of the bestselling book "The Complete Guide to Day Trading" - Click Here to download it now.
Hello Mark,
thank you for your article. You opened my mind to a new way to trading.
The geniality is in the semplicity.
I'm testing my trading system after an important adjust before your article, and it seems to be right! It's great!
I apply it to a Daily chart to find more important trend!
Thank you again
Italo
My optimizations some of my own expert advisors (robots) results in RSI=14, and RSI=6 as the most appropriate values for RSI. Tested on GBPUSD, 15 min chart. Thanks for article.
Hi Hubert,
In response to your question, I personally use RSI for trend confirmation in conjunction with other indicators (MACD and Bollinger Bands in my case), and RSI is not the sole reason for entering a trade. To answer your question though, I'm more interested in entering a trend when RSI is confirming the move (as presented in this article), then I'll use fixed profit targets/stops and my other indicators to make a decision on whether to exit a trend. In my experience the first cross back below 70 in an uptrend, or back above 30 in a downtrend, isn't as significant, and one of our strategies actually looks to enter on this pullback expecting another push in the direction of the trend.
Many traders look for trend confirmation to find the strongest trends. Whether it be multiple timeframes or multiple indicators, the idea remains the same. For me, using RSI in the way discussed in this article is that last piece of confirmation that helps me spot beautiful intraday trends.
Happy Trading!
Mark
Hi David,
I personally prefer using Range Bars. Range Bars show pure price movement and in my experience range bars will filter out a lot of the noise that is experienced using time bars. Take a look at range bars, but you can also apply this concept to other time frames to see if using RSI for trend confirmation helps you with your trading.
Happy Trading!
Mark
Hi Bill,
The calculation of RSI is readily available on the internet and calculated automatically using most charting software. But since you asked:
RSI = 100 - (100/1+RS)
RS = Average of 14 day's closes UP/Average of 14 day's closes DOWN
This is the calculation that Welles Wilder introduced but since I personally use a 7 period setting, the day's closes up and closes down would be adjusted to 7.
Happy Trading!
Mark
Hi Mark, verry interesting for the 7 period in trend markets. I have a question. On the second graph, if you enter long on the second oversold signal, how would you react on the three bars when the RSI pulls back bellow the 70 line? Would you consider taking profit or half of it?
Thanks
Useless information and overtly obvious; oscillator and cyclic indicators typically hit the top or bottom of their periodicity on a trend and thus provide no more information other than oversold or overbought. Really, that is the best you can do with RSI?
Plz advise which time frame you use. As different time frames give different indications. I.E. 5min 15min 30min 1hr etc.....Thanks.
why do you consider RSI and not Stockastic slow?
Relative to what? You did not explain how RSI calculated.
thanks for this artical .
quiusiera saber las tendencias con respecto a los precios del cafe y tambien saber cual es el motivo de su variacion
would like to know the trends in the prices of coffee and also know what the reason for variation
-Translated by Google