

From time to time, we here at the Traders Blog will feature a person or product that stands out in the trading world. Today that trader is Alan Knuckman of the Wizard.com. Alan will be sharing part of his Trend Trade and break out trading strategy. Be sure to comment below with your thoughts and questions.
Hello traders I’m Alan Knuckman, Senior Market Strategist. I can be seen every week on financial television networks such as CNBC, Bloomberg, FOX Business and Reuters. I’m blogging today about my favorite trading strategy and my weekly trend breakouts for the week of November 7th.
With over 20 years plus experience in the markets, it has been proven to me that the real money is made on established trends. Chasing turns and trying to pick tops or bottoms is extremely dangerous and only a gamble at best. Financial success on the other hand is about repeatedly identifying high probability candidates and taking a chunk out of the proven market momentum.
1) Identifying the Trend – As all of us traders know, trading with the trend of the markets significantly increases the chances, or probabilities, for a trade to be successful. But the “trading with the trend” mantra is easier said than done for many investors. This approach is very straight forward until you need to break down the trend time frame. The yearly, monthly or weekly trends can be moving in different directions and it is important that you only choose candidates that have internal forces working together. The longest time frame IS the overriding trend that must be respected as the driver of direction.
This is similar to the science of momentum: A body in motion will tend to remain in motion until acted upon by an outside force; A body at rest, stays at rest. In trading, that resting does us no good and should be eliminated as a trading selection until a trend is established. Let the market show you the movers to jump aboard.
2) Trading Breakouts - The price breakout strategy looks for new highs/lows on a monthly, weekly, daily or minute interval basis and the high odds of the future continuation of this momentum strength. The beauty of trading breakouts is IF new highs or lows are NOT achieved you have zero risk because an entry has not been triggered.
The elimination of anticipating what the market is going to do by only trading real breakouts saves money and aggravation from countless frustrating false moves. A new relative high/low for whatever time frame you follow is a proven sign of the momentum breakout that renews the trend strength once again.
Though I still dabble in short term trading, I don’t do it nearly to the extent as earlier in my career. My flexible lifestyle, doing the things I truly enjoy, is now more conducive to longer term trading with investments for many weeks and months. The plays I’m looking for now are “Weekly Breakouts” that are going in the same direction as the market’s overall trend.
Let’s Look At This Weeks Potential Trend – Breakouts
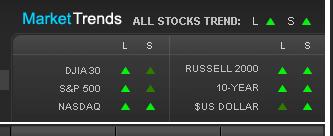
Step 1. Determine the Market Trend
The markets have been in an interesting place. One day they’re up huge and the next day they’re down just as big. It’s volatility at its finest. So which direction is the market moving in? Basically we are in a trading range, but as my trend indicator tells me, we are starting to move to the upside. Here are the current trends for major indices (L = weekly trend, S = daily trend. Bright Green is Very Bullish, Light Green is Moderately Bullish)
Step 2. Find Breakout Candidates
So if the major indices are all bullish, I’m going to look for breakouts to the long-side. I run a scan on over 13,000 stocks for weekly breakout candidates. I only want breakouts that have very bullish trends in both the long-term and short-term trends. I also only want stocks that are above $5.00 and have weekly volume over 30,000,000.
Here’s what I came back with:
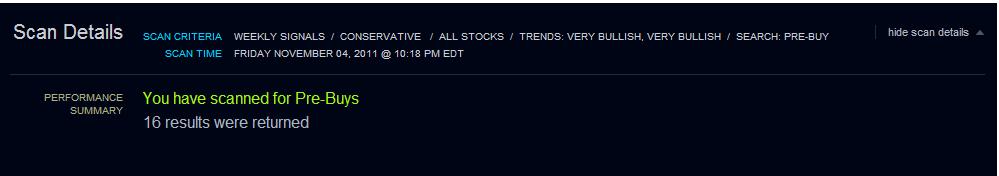
16 results are too many for me to look at, so I increase my weekly volume to over 50,000,000 and here’s what my scan came back with:
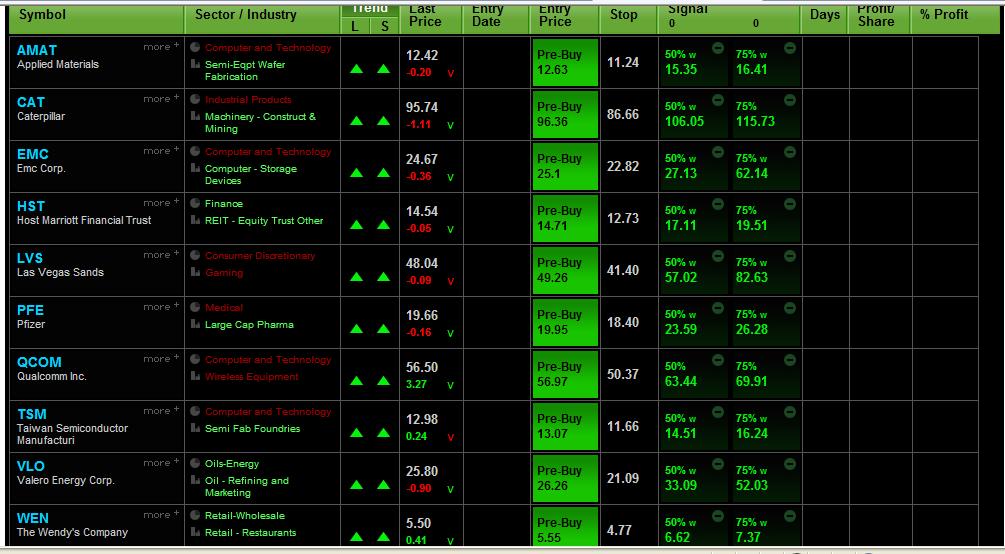
There are 10 stocks that came back from my scan that fit my criteria. As you can see, all of these have strong (bright green) long and short-term trends. From here, I also look at each stock’s Sector and Industry trends. Again a safer play is to also have the Sector and Industries in trend agreement. There are two issues that I will immediately take off my list because of this (LVS and QCOM). That leaves me with eight.
The breakout price is the “Entry Price” on my scan results. I will put in a “Buy Stop Limit” orders with my broker on these eight trades at the Entry Price. I will also put in the stop loss price (the price in the “Stop” column) for if and when the trade is triggered.
Now you might think that eight trades are too much. Remember we are placing these trades on “Breakout Prices” so there’s no guarantee that all will be actually bought. In my experience, maybe 3-4 of these will hit their breakout price trigger. Again, this is fine. I don’t want to take the trade if the price doesn’t breakout, so only give me the trades with highest upside momentum strength.
Next week on my Monday November 14th blog, we will update and review these plays to see what was executed and how they are doing. I will also show you how to increase the returns in this breakout strategy by using options. The capital required for options is less and the trades have completely limited risk to the premium paid.
See you next week,
Alan Knuckman
Trade platform comments
The trend trade breakout strategy has many challenges from what time frames to follow and how to evaluate all of the thousands of markets choices for opportunities. It can be done on your own but time is such a precious asset to a trader that a trading tool to automate the process is truly valuable.
For many years, I was manually determining the market trend and breakout prices. Then I ran across an article in the Dallas Morning News which reviewed a trading tool called The Wizard that did both.
I subscribed to The Wizard and tested it out for a couple of months. In finding the trends of the market, it is very accurate. Not only does it give market direction, it also breaks down the trends for specific industries, sectors and individual stocks, ETFs, futures and currency pairs.The value of a trading tool is measured by success and ease of use.
The Wizard updates every night for daily breakouts and on Friday night for the weekly information. A quick scan using my filters generates what I need for the week ahead. Just place the entries and stops on the trend trading breakout candidates… it’s just that easy.
Their breakout prices are what I was really impressed with. The great thing about The Wizard is that you can quickly scan the entire market for potential breakout candidates, which saved me many hours every day trying to find the trade opportunities.
The Wizard is currently running a couple of great offers on the tool. They are waiving their initial set-up fee (which can save you up to $400), so all you have to pay is the $99 monthly subscription fee. There’s also a 30-day money back guarantee with the product, allowing you to test the product out for a month. They also are giving away their Market Trend Indicator for free. This tool tracks the trends in the major indices.
To receive either of these deals, just go to The Wizard and in the upper right hand corner is the sign-up for the free Market Trend Indicator and under the “Products” tab is where you can receive the “no set-up fee” offer.
If you’d like more information on The Wizard, send an email to bi**@th*******.com and they will answer any questions you may have.
Good Morning
On what are based your trend indicators : moving average, linear regression, rsi or ???
It is not easy to determine a trend.
What are you doing when 2 trends ( for example weekly and daily ) are opposite
Thank you for an answer
Michel