
Each week Longleaftrading.com will be providing us a chart of the week as analyzed by a member of their team. We hope that you enjoy and learn from this new feature.
Since the start of 2012, the June Euro Currency has traded in a range between 126.35 and 1.3496. Most of the time, the price was narrowed into a range that was finally broken last week on Friday after the United States non-farm payroll disappointed. The lackluster report was combined with anticipatory selling ahead of elections in France. The drop in futures prices continued on Sunday night after France elected a member of the Socialist party into office for the first time in over twenty years. Surprisingly, the initial drop on Sunday night was short lived and technical trading took over. The chart below clearly shows the targets that the trade had in its sights.
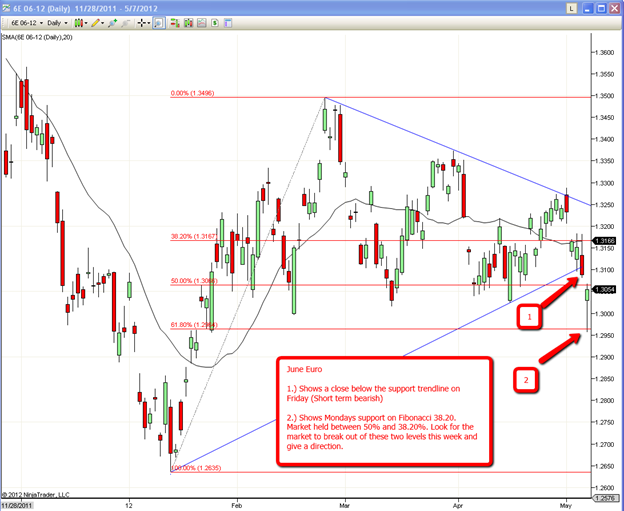
Arrow 1.) points out Fridays close below the support trendline that has underpinned the market since the beginning of the year. Traders read this as a bearish signal for the next day’s trade. On Sunday night, sellers in the Euro Currency blew straight through the Fibonacci 50% retracement and found support on the next level down. This came in near the 61.80% Fibonacci and a price of 1.2957.
Market bears were obviously disappointed in today’s recovery back to the 50% retracement, but it will give technicians something to think about this week as we see how the Euro performs after a convincing finish last week.
I will be advising my customers to be on the lookout this week for two things. First, the bear camp will want to see closes below 1.2957 to confirm a substantial leg lower. Conversely, market bulls will hope for today’s low to hold, but would really like to see the Euro close above the resistance trendline that prices slightly above 1.3200. Any price action between would overall be considered range trading.
Please feel free to comment on the material provided through the website or directly to me at my office. My direct email address is
bb****@lo*************.com
or by telephone at (888) 272-6926.
Initial breakdown could be a fake.
This would be a great time for the ECB OR the US FED to step in and do something, but until that news come, the panic selling will likely continue
Thank you for the replies and the input.......yes, even you Sara.
In an effort to reach a wide audience, I tend to use daily charts as a basis for my trade ideas. My role as a Senior Market Strategist at Long Leaf Trading Group is to assist customers in their trading accounts by providing technical and fundamental data, along with trade recommendations, if they are open to them.
I start with a daily chart to look for direction and technical levels, then break down the chart into 60, 30, even 15 minute charts, depending on whether the trade is a longer or shorter term idea.
The Euro's price action and direction on a day to day basis (along with the US Dollar) can be difficult to commit to in this current environment. The main reason is because both the US FED and the ECB made it clear that they stand ready to commit to easing the markets whenever they feel the time is right. Additionally, there have been many days when the currencies will make a large move overnight (in Asian and European trading) and reverse the move in the US trade. This is further feuled by a lighter volume trade overall.
The reason that I point out levels that may seem wide, is because the currencies are at a tipping point. Traders are watching 1.300 in the Euro and 80.00 in the US Dollar. As we speak, the markets are at the respective prices. This weeks trade will be huge for direction.
If anyone that responded to this chart would like to discuss a shorter term breakdown of the June Euro, please feel free to call or email me. I would be more than happy to share my thoughts on that as well.
Thanks again!
(888) 272-6926
bb****@lo*************.com
I'm inclined to agree with Owen. I would draw that lower triangle leg more horizontal around the 1.30 range making it a right triangle with a recent break downward. Further movement below 1.2950 would confirm the downside move. Technical trading aside, we cannot ignore geopolitical events with French and Greek elections providing uncertainty, and elevated bond yields in Spain, Portugal, Italy, ... There's a good case for liquidity infusion/stimulus/euro printing to ease austerity pains which would weaken the Euro. Of course Merkel won't be making that case. That said, the technicals showing a possible short term breakdown could be just reflecting the overall sentiment that some currency devaluation may be necessary to provide the austerity relief many in the Eurozone are demanding. At this point the Euro may just be headed lower as Forex traders sell Euros to move to stronger currencies or other asset classes due to the fear of uncertainty. What do I know?
Also, just for clarification, I would be inclined to start the lower trendline of my symmetric triangle from the bottom of the large green candle on 16 February rather than the earlier one you have, beginning on 13 January. It highlights the consolidation and breakout better.
Seems to me we have a downward breakout after a long period of consolidation in the form of a symmetrical triangle pattern on the daily chart. It has also retraced back to the triangle and now seems to be continuing downward. But I agree with you - the forex market being what it is, to feel confident of a longer term downward move, I would be waiting for confirmation in the form of a close below 1.2957.
yes i agree with you .....
The threat of capital flight and runaway inflation will quickly force Hollande to shift gears and move toward the policies of Sarkozy ......... His absurd taxation and spending proposals are doomed ... Please note that support is rapidly increasing for conservative hardliner MME. Le Pen !.....The legitimate citizens of France are tolerant - but they are not communists - and will revolt if pushed too hard !
i am bearish , but i think this broken rising trend line means nothing in this chart , thanks
what analysis... you confused me and usual nonsense of giving a big range.. you go this way you are bearish .. you go that way you are bullish... crap