My Favorite Swing Trading Strategy

By: Cory Mitchell, founder of VantagePointTrading.com

Whether I'm day trading or swing trading forex (and other markets as well), I frequently use the method described below. It's a price action trading method, with trendlines and trend channels used to help establish entry points and potential targets. Here's the basic strategy; adjust it to your liking or add your own indicators to help you implement it.

Before Placing Trades

Before placing a trade, calculate your proper position size. Position size is calibrated for the trade so you are risking 1% (or less) of your account capital on each trade. All trades taken must have at least a 2:1 reward:risk ratio, but often we'll end up with trades that have a 5:1 or 6:1 ratio (more on that in a bit). If risking 1% of your account, you stand to make at least 2%, but often 5% or more...that's 5% on your total account, not just traded capital (because our risk is also based on the total account). If you risk up to 2% per trade, your gains double.

Before commencing trade, note any significant economic data coming out over the next 24-hours. Avoid placing entries or stop loss orders close the current price right before a major news announcement, as this can cause slippage. Best to avoid those trades. Continue reading "My Favorite Swing Trading Strategy"

US Stocks: The TrendLine Between Bull and Bear

By: Elliott Wave International

Last weekend, I went on a road trip with a friend and her two young sons. The second we left the driveway, the older boy placed a rubber pool noodle in between him and his brother and established the most important ground rule of all sibling driving trips:

"Don't cross this line or else."

Impressively, an entire hour passed without incident when my friend spied the younger son teasingly edging his elbow toward the very outskirts of the noodle, baiting his luck.

Anticipating the ensuing reversal of our event-free driving experience, my friend pre-emptively pulled over to the side of the road, when in -- 3-2-1! -- a small arm crossed the line and a giant tantrum ensued.

Then, it hit me: Continue reading "US Stocks: The TrendLine Between Bull and Bear"

3 Ways to Identify Support and Resistance - 5 Chart Examples

By: Elliott Wave International

Today's lesson considers three ways to identify price support and resistance in the markets you trade.

  1. Previous highs and lows
  2. Trendline support
  3. Fibonacci Ratios

These examples are adapted from Jeffrey Kennedy's Trader's Classroom service.

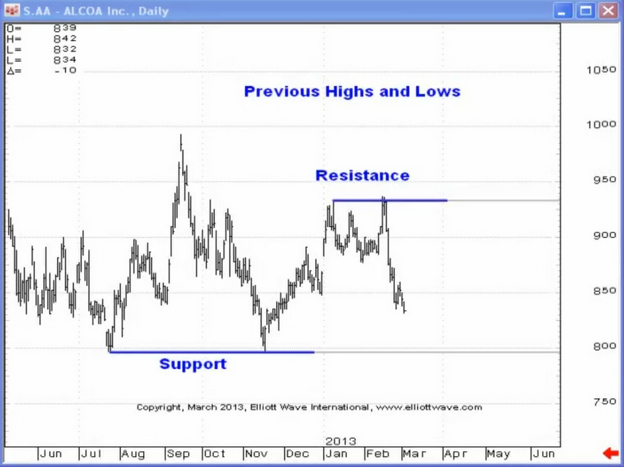
1) Uptrends terminate at resistance while downtrends terminate at support. Previous highs and lows often act as resistance and support.

In ALCOA Inc (AA), the September 2012 selloff found support near the previous July 2012 low.

The February 2013 peak occurred following a test of resistance at the January peak at $9.33. Continue reading "3 Ways to Identify Support and Resistance - 5 Chart Examples"

Here's Why Trendlines Are Your New Best Friend, Part 2

By Elliott Wave International

One of the best aspects of technical analysis is also its biggest drawback: Namely, there are far too many indicators to choose from.

Candlesticks to channels, Relative Strength Index to Bollinger Bands, double tops to moving averages...

Geez! With so many options, you're liable to feel like a "hanging man" beneath "dark cloud cover."

But in reality, all you need is one good, solid place to start; one indicator that can be your technical rock of Gibraltar. Continue reading "Here's Why Trendlines Are Your New Best Friend, Part 2"

Here's Why Trendlines Are Your New Best Friend, Part 1

By: Elliott Wave International

If financial market speculation were easy, then everyone would be well off -- and the legendary investor Warren Buffett would be just a nice rich guy from Omaha with really cool glasses.

The reality is, successfully navigating the near- and long-term trends is exceptionally difficult. Gains can be big, but losses can often be even bigger.

Technical analysis offers you an all-you-can-watch buffet of indicators to help reduce your risk and optimize rewards. You may already be using moving averages or momentum indicators, for example -- and you know how helpful they can be at anticipating trend changes.

Well, let us introduce you to another excellent tool: trendlines.

For the past 15 years, Elliott Wave International's chief commodity analyst Jeffrey Kennedy has been using trendlines to identify high-probability trade set-ups in close to 20 markets he regularly follows.

You might be familiar with one of those markets, cocoa. In his May 2014 Monthly Commodity Junctures, Jeffrey showed subscribers how to apply trendlines to this volatile market: Continue reading "Here's Why Trendlines Are Your New Best Friend, Part 1"