
Hello MarketClub members everywhere! How do you feel about the economy, the world, the elections, ISIS or ISIL...? Take your pick.
The other day at a general staff meeting I posed that same question to our amazing team here at MarketClub. I have to say that it was no surprise that they felt there was great uncertainty in the air. It wasn't just one thing, it was a combination of things that made them feel a little uneasy.
So the question is, how do you feel about the markets?
To me, something just doesn't seem quite right. It's not just one thing, it seems to be a combination. The reality is, the markets cannot keep going higher based on cheap money because sooner or later it's going to implode unless the Fed wakes up and gets real. On the fringes you have Puerto Rico running out of money and who's going to bail them out? Across the ocean, Greece is once again close to imploding. Who's going to bail them out? The IMF?
Are stocks at a tipping point?
I feel a little uneasy this morning with the markets close to major resistance levels and also very close to the PSAR on the downside. Here are the levels I'm looking at in each of the major indices. If these PSAR levels are broken, it would indicate further weakness.
DOW (INDEX:DJI): 17,498.02
S&P 500 (CME:SP500): 2,035.14
NASDAQ (NASDAQ:COMP): 4,838.62
Watch these levels carefully today, particularly towards the end of the day.
Gold (FOREX:XAUUSDO): The gold market has been particularly interesting considering the choppy action of yesterday. This type of action caused a positive signal on the PSAR. Since the beginning of the year, there have only been two signals on the upside with this indicator. The first signal produced a rally of $169 while the second signal produced a rally of $27. Another indicator to watch carefully today is the RSI, which is just below the 50 line. A close over that line would indicate an upward trend. It is also worth noting that the second quarter for gold has an 80% success rate when following the Trade Triangles. At the moment, only the long-term monthly and daily Trade Triangles are positive. Conservative traders should wait for the weekly Trade Triangle to turn green before getting aggressive on the long side of gold.
Crude Oil (NYMEX:CL.K16.E): The price of crude oil reached my downside target around $35.50 a barrel yesterday and came within a few points of its 61.8% Fibonacci retracement target zone. As I expected, support came in around those levels. Aggressive traders who took my advice should exit this counter trend trade today and take a nice short term profit out of this market. At the moment, the trend remains negative and I expect to see more of a trading range around current levels as this market decides what it wants to do next. Crude oil would have to move over the $39.44 level before the PSAR turns positive. I still view the major trend as negative and we may have further to go on the downside.
In today's market lesson I'm going to show you the correct way to interpret and successfully use the MACD indicator. The MACD was developed by a friend of mine, Gerald Appel and is a great way to follow the trends. I know that Gerald uses this indicator to manage money and has been very successful with it. In this short video, you will quickly grasp the Gerald's concept and how you can successfully use the MACD indicator in your trading.
I'm looking forward to hearing from you with any questions or comments you have on the markets.
Stay focused and disciplined.
Every success with MarketClub,
Adam Hewison
President, INO.com
Co-Creator, MarketClub
Rasesh,
Thank you for your comment and feedback.
All the best to you,
Adam
I'm Curious Adam. I watched Tesla when it was down around $145 and at that time you were saying Tesla was going lower so I held off buying even though it was at support. At that time, you were predicting doom and gloom, for Tesla because of low oil prices. Now it's bounced over $100 and you now you love the stock despite having missed that big move. I wondered if you could say more about how all that came about and your analysis.
Keith,
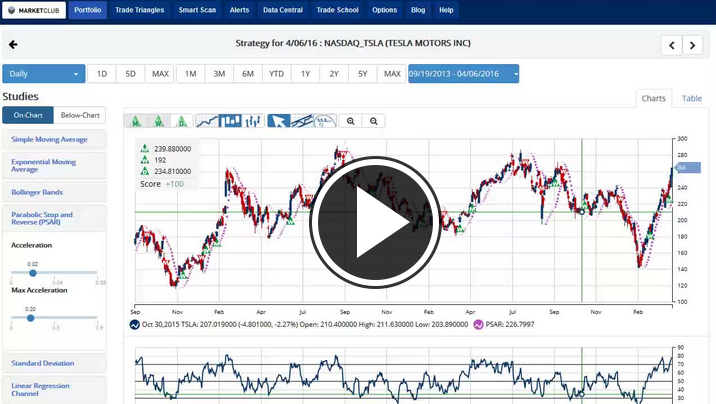
Thank you for your question, as you may know we trade Tesla and many other stocks using our Trade Triangle technology. Using this same market proven Trade Triangle technology we shorted Tesla at $214.07 on January 7. That position was covered on February 29 and $192 for profit of $22. We subsequently were out of the market until 1 April where we took a position at $239.88. As of this right now Tesla is currently trading at $260 giving us a profit of just over $20 on paper.
Tesla closed out 2015 at $240. If you look at where we are trading now Tesla is only up $20 for the year less than 10%. Our Trade Triangle technology is up 16%, that is why we follow the Trade Triangles because they work and work consistently.
Your question was why was I bearish – well all our Trade Triangles were negative at that time, I do not like to trade against the major trend. I think we can both agree that the move on the upside in Tesla was extraordinary, I don't know any person who predicted that kind of mood in such a short period of time. As I mentioned we exited our short position on February 29 at $192 – the market is 260 now so that's $62 away.
I hope this addresses your question and answers it for you.
Every success using our Trade Triangle technology in the future.
All the best,
Adam
Nothing Great,,,,,,,,,,,,,,,,,,,,,,,,,,,,,,,,,, Nothing surprising,,,,,,,,,,,,,,,,,,,,
I think, this is quite hard to accept,,,,,,,,,,,,,,,,,,,,,,But, But But,,,,,,,,,,,,,,,,,,,,,,,,,,,
this is simply a "certain" uncertainty, and all Market Know this Fact in a far batter way.....................