
Influenced by hotter-than-expected inflation and employment data for September, the Fed will most likely announce another aggressive rate hike in its meeting next week, raising recession odds. Goldman Sachs believes there is a 35% chance of a recession in the next 12 months.
However, despite lingering macro headwinds, the stock market witnessed a relief rally since mid-October, with initial corporate earnings beats boosting investor sentiment. The S&P 500 gained close to 7% over this period.
Earlier this week, Morgan Stanley's equity strategist Mike Wilson said that the stock market could see a 13% rally in the near term. However, we believe the S&P 500 needs to trade above its 200-day moving average to find strong support.
Investors doubt the market's continued rally following disappointing big tech earnings, but one could take advantage of the strong uptrend in O'Reilly Automotive, Inc. (ORLY) and Poshmark, Inc. (POSH) by watching them closely.
O'Reilly Automotive, Inc. (ORLY)
ORLY and its subsidiaries operate as a retailer and supplier of automotive aftermarket parts, tools, supplies, equipment, and accessories in the United States. It has a market capitalization of $49.12 billion.
Over the last three years, ORLY has grown its revenue at an 11.9% CAGR, while the company's EBITDA has grown at a 15.2% CAGR.
For the second quarter ended June 30, 2022, ORLY’s sales came in at $3.67 billion, up 5.9% year-over-year. Its gross profit increased 3.2% year-over-year to $1.88 billion. In addition, its operating income increased marginally year-over-year to $798.55 million.
The consensus revenue estimate of $14.15 billion for fiscal 2022 represents a 6.2% improvement year-over-year. Also, Street expects ORLY's EPS to grow 2.5% year-over-year to $31.87 during the same period.
ORLY's stock is trading at a premium, indicating high expectations regarding the company's performance in the upcoming quarters. In terms of forward P/E, ORLY is trading at 24.36x, 86.6% higher than the industry average of 13.05x. Also, it is trading at a forward Price/Sales multiple of 3.47, compared to the industry average of 0.82.
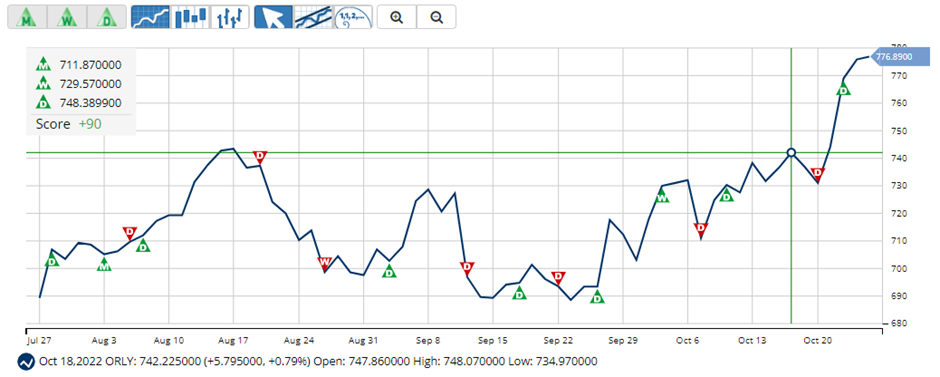
The stock is currently trading above its 50-day and 200-day moving averages of $718.36 and $676.81, respectively, indicating a bullish trend. It has gained 12.7% over the past month to close the last trading session at $775.73.
MarketClub's Trade Triangles show that ORLY has been trending UP for all the three-time horizons. The long-term trend for ORLY has been UP since August 3, 2022, while its intermediate-term and short-term trends have been UP since October 4, 2022, and October 24, 2022, respectively.
The Trade Triangles are our proprietary indicators, comprised of weighted factors that include (but are not necessarily limited to) price change, percentage change, moving averages, and new highs/lows. The Trade Triangles point in the direction of short-term, intermediate, and long-term trends, looking for periods of alignment and, therefore, intense swings in price.
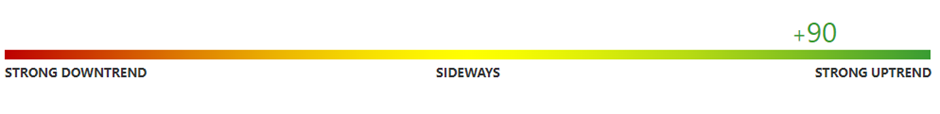
In terms of the Chart Analysis Score, another MarketClub proprietary tool, ORLY scored +90 on a scale from -100 (strong downtrend) to +100 (strong uptrend), indicating that the uptrend will likely continue. While ORLY shows intraday weakness, it remains in the confines of a bullish trend.
The Chart Analysis Score measures trend strength and direction based on five different timing thresholds. This tool considers intraday price action; new daily, weekly, and monthly highs and lows; and moving averages.
Click here to see the latest Score and Signals for ORLY.
Poshmark, Inc. (POSH)
POSH operates as a social marketplace for new and secondhand style products in the United States, Canada, India, and Australia. With a market capitalization of $1.41 billion, POSH offers apparel, footwear, home, beauty, pet products, and accessories. Over the last three years, POSH has grown its revenue at a 30% CAGR.
For the second quarter of the fiscal year 2022 (ended June 30, 2022), POSH's net revenue stood at $89.10 million, up 9.2% year-over-year. POSH's Gross Merchandise Value increased 7.5% year-over-year to $483.50 million, while its trailing-12-months active buyers hit 8 million, up 14.3% year-over-year.
The consensus revenue estimate of $358.44 million for fiscal 2022 represents a 9.9% improvement year-over-year. Also, its revenue is expected to increase 9.6% year-over-year to $92.30 million for the quarter ending December 2022.
POSH's stock is trading at a premium. Its forward EV/Sales is 2.33x, 118.9% higher than the industry average of 1.06x. Also, the stock's forward Price/Sales multiple of 3.93 compares to the industry average of 0.82.
The stock is currently trading above its 50-Day and 200-Day moving averages of $14.25 and $12.95, respectively, indicating a bullish trend. It has gained 23.8% over the past month to close the last trading session at $17.80.
MarketClub's Trade Triangles show that POSH has been trending UP for all the three-time horizons. The long-term trend for POSH has been UP since August 8, 2022, while its intermediate-term and short-term trends have been UP since September 12, 2022, and October 25, 2022, respectively.
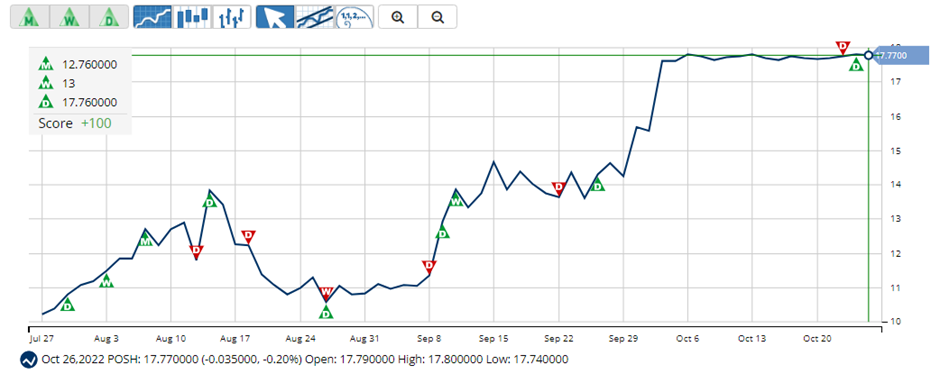
In terms of the Chart Analysis Score, POSH scored +100 on a scale from -100 (strong downtrend) to +100 (strong uptrend), indicating that the uptrend will likely continue. Traders should protect gains and look for a change in score to suggest a slowdown in momentum.

Click here to see the latest Score and Signals for POSH.
What's Next for These Stocks?
Remember, the markets move fast and things may quickly change for these stocks. Our MarketClub members have access to entry and exit signals so they'll know when the trend starts to reverse.
Join MarketClub now to see the latest signals and scores, get alerts, and read member-exclusive analysis for over 350K stocks, futures, ETFs, forex pairs and mutual funds.
Best,
The MarketClub Team
su*****@in*.com