
With increasing climate change concerns, rising costs of fossil fuels due to geo-political turbulence and ever-depleting supplies, and growing inclination toward lower operational and maintenance costs, the global automotive industry is fast transitioning toward e-mobility.
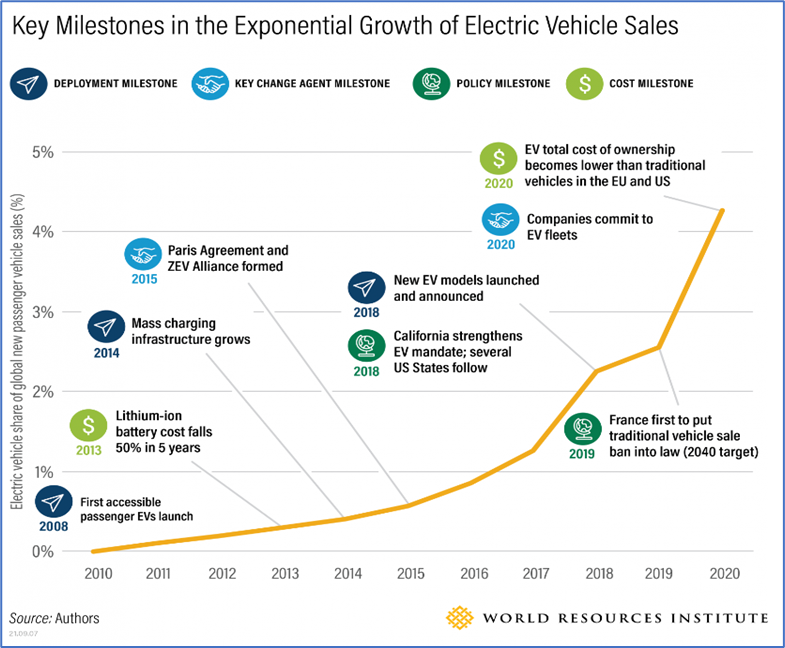
Including electric vehicles, charging networks, infrastructure, and energy storage, the global electric mobility ecosystem is projected to grow at 23.7% CAGR between 2022 and 2029. The following chart illustrates the key milestones in the impressive growth trajectory of electric vehicles.
While high input and borrowing costs amid record-high inflation and an increasing interest rate environment impeding the EV industry’s growth, EVs are expected to keep replacing Internal combustion engine vehicles at an increasing rate each year.
However, since the EV industry is expected to bear the brunt of the macroeconomic headwinds in the near term, investors are advised to exercise caution and not to bottom fish NIO Inc. (NIO) and Blink Charging Co. (BLNK), as some technical indicators point to further downside in these stocks.
NIO Inc. (NIO)
China-based NIO designs, develops, manufactures, and sells high-end smart electric vehicles. With a market capitalization of $16.01 billion, the company also offers energy and service packages; design and technology development activities; manufacture of e-powertrains, battery packs, and components; and sales and after-sales management activities. Over the last three years, NIO’s revenue has grown at a 70.6% CAGR.
During the second quarter of the fiscal year 2022 ended June 30, 2022, NIO’s adjusted loss from operations widened 360.1% year-over-year to $351.60 million due to Covid-related challenges and cost volatilities. The company’s adjusted net loss came in at $338.50 million, widening 575.1% year-over-year, while its adjusted net loss per ordinary share worsened by 538.1% from the prior-year period to $0.20.
NIO is expected to report a loss of $0.71 per share for the fiscal year ending December 2022. The company is also expected to incur a net loss during the next fiscal year. Additionally, the company has missed its consensus EPS estimates in each of the trailing four quarters.
NIO is currently trading at a premium compared to its peers, indicating a downside risk of holding the stock. In terms of forward EV/Sales, NIO is trading at 1.64x, 52.2% higher than the industry average of 1.08x. Also, it is trading at a forward Price/Sales multiple of 1.99, compared to the industry average of 0.83.
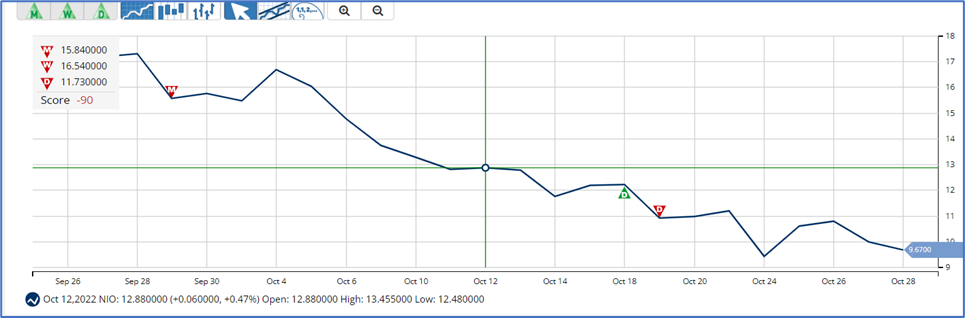
The stock is currently trading below its 50-day and 200-day moving averages of $16.35 and $19.34, respectively, indicating a downtrend. It has lost 42.8% over the past month to close the last trading session at $9.69.
MarketClub’s Trade Triangles show that NIO has been trending DOWN for all three-time horizons. NIO's long-term and intermediate-term trends have been DOWN since September 29, 2022, while its short-term trend has been DOWN since October 19, 2022.
The Trade Triangles are our proprietary indicators, comprised of weighted factors that include (but are not necessarily limited to) price change, percentage change, moving averages, and new highs/lows. The Trade Triangles point in the direction of short-term, intermediate, and long-term trends, looking for periods of alignment and, therefore, intense swings in price.
In terms of the Chart Analysis Score, another MarketClub proprietary tool, NIO scored -100 on a scale from -100 (strong downtrend) to +100 (strong uptrend), indicating that the downtrend is likely to continue. Traders should use caution and set stops.

The Chart Analysis Score measures trend strength and direction based on five different timing thresholds. This tool considers intraday price action; new daily, weekly, and monthly highs and lows; and moving averages.
Click here to see the latest Score and Signals for NIO.
Blink Charging Co. (BLNK)
With a market capitalization of $735.74 million, BLNK owns, operates, and provides electric vehicle (EV) charging equipment and networked EV charging services in the United States and internationally.
The company’s segments include the Blink EV charging network (the Blink Network) and Blink EV charging equipment, also known as electric vehicle supply equipment (EVSE), and other EV-related services. BLNK has grown its revenue at a 67% CAGR over the last five years.
In the fiscal 2022 second quarter ended June 30, 2022, BLNK’s loss from operations widened 77.9% year-over-year to $21.96 million, while the adjusted EBITDA deteriorated 93.9% year-over-year to $15.60 million. The company’s net loss widened 68.1% year-over-year to $22.62 million. This translates to an adjusted quarterly loss of $0.41 per share, worsening 32.3% year-over-year.
Analysts expect BLNK’s loss per share for the fourth quarter of the current fiscal year (ending December 2022) to widen 8.9% year-over-year to $0.49. Furthermore, BLNK has missed the consensus EPS estimates in three of the trailing four quarters.
Despite the weak business performance, BLNK is trading at a frothy valuation compared to its peers. In terms of forward EV/Sales, BLNK is trading at 11.89x, 630% higher than the industry average of 1.63x. Also, it is trading at a forward Price/Sales multiple of 13.34, compared to the industry average of 1.26.
The stock is currently trading below its 50-day and 200-day moving averages of $18.40 and $20.18, respectively, indicating a bearish trend. It has lost 20.6% over the past month to close the last trading session at $14.47.
MarketClub’s Trade Triangles show that BLNK has been trending DOWN for two of the three-time horizons. The long-term and intermediate-term trends for BLNK have been DOWN since October 7 and September 22, 2022, respectively. However, its short-term trend has been UP since October 25, 2022.
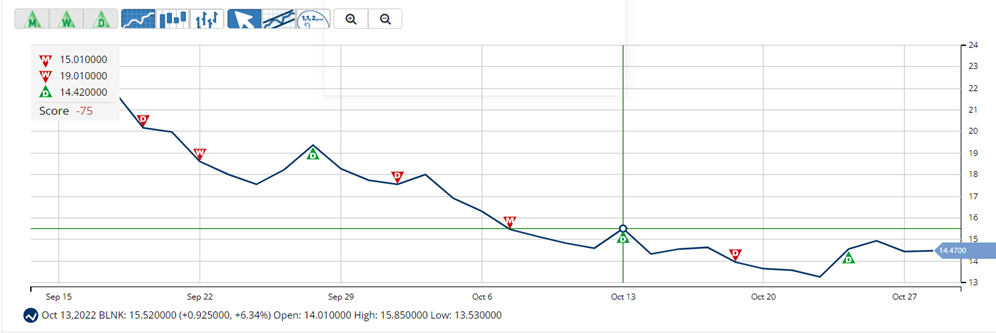
In terms of the Chart Analysis Score, BLNK scored -85 on a scale from -100 (strong downtrend) to +100 (strong uptrend), showing short-term strength. However, look for the longer-term bearish trend to resume. As always, continue to monitor the trend score and set stops.

Click here to see the latest Score and Signals for BLNK.
What's Next for These EV Stocks?
Remember, the markets move fast and things may quickly change for these stocks. Our MarketClub members have access to entry and exit signals so they'll know when the trend starts to reverse.
Join MarketClub now to see the latest signals and scores, get alerts, and read member-exclusive analysis for over 350K stocks, futures, ETFs, forex pairs and mutual funds.
Best,
The MarketClub Team
su*****@in*.com