
The consumer price index (CPI) increased 7.7% year-over-year in October, lower than expectations. This indicates that the inflationary pressures have started to cool.
Thanks to the slightly cooled inflation, the S&P 500 has gained 7.7% over the past month, while the Dow Jones and Nasdaq Composite climbed 10.6% and 5%, respectively.
Furthermore, Fed Vice Chair Lael Brainard signaled that the Fed would likely slow the pace of its interest rate hikes.
The U.S. Census Bureau reported that the overall retail sales in October grew 1.3% from September and 8.3% year-over-year.
“October’s performance is a strong foothold as we go into the holiday season,” said NRF Chief Economist Jack Kleinhenz. Thus, holiday spending is expected to remain healthy despite the recent inflationary pressures.
According to the latest forecast by the National Retail Federation, holiday retail sales during November and December will advance between 6% and 8% over the last year to $942.60-$960.40 billion.
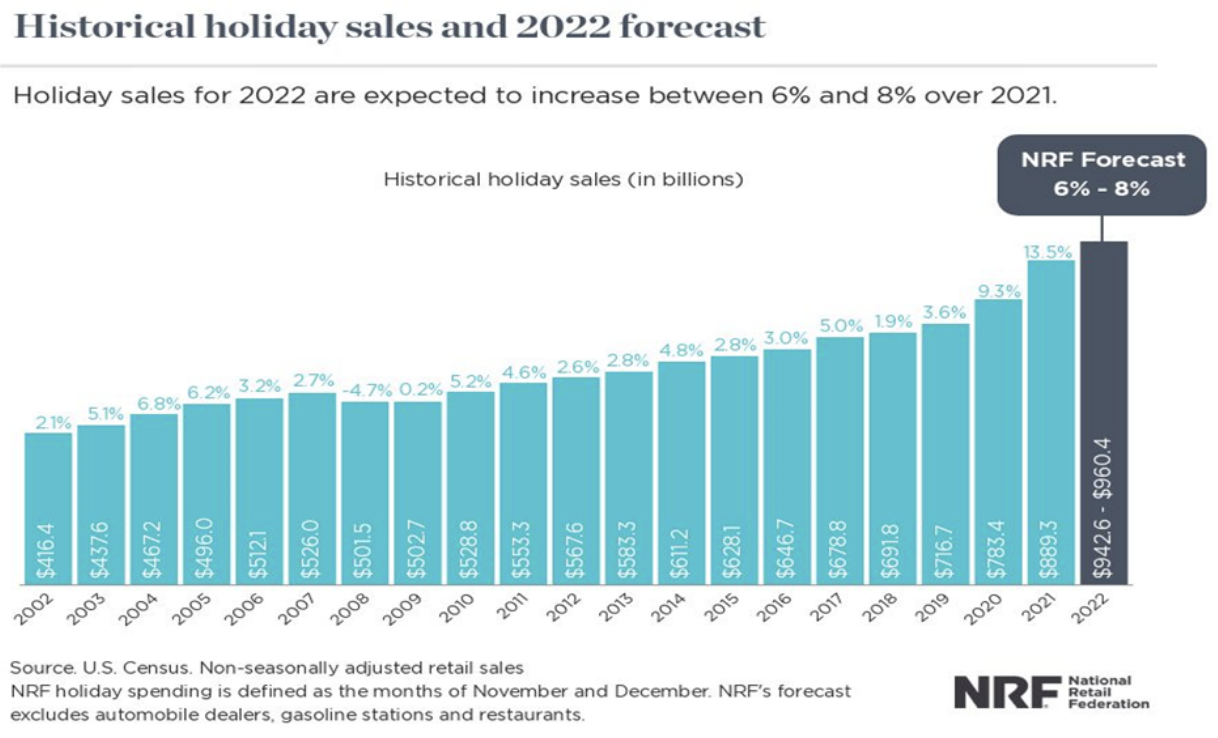
“While consumers feel the pressure of inflation and higher prices, and while there is continued stratification with consumer spending and behavior among households at different income levels, consumers remain resilient and continue to engage in commerce. In the face of these challenges, many households will supplement spending with savings and credit to provide a cushion and result in a positive holiday season,” said NRF President and CEO Matthew Shay.
Given this backdrop, investors should load up on Utz Brands, Inc. (UTZ) and Westrock Coffee Company, LLC (WEST) to prepare their portfolios for the holiday season by taking advantage of their uptrends.
Utz Brands, Inc. (UTZ)
UTZ operates as a snack food manufacturing company. Its offerings include a range of salty snacks under the Utz, Zapp’s, ON THE BORDER, Golden Flake, Boulder Canyon, Hawaiian, TGIF, and other brand names. The company distributes its products to grocery, mass, convenience, drug, and other retailers. UTZ’s revenue has grown at a CAGR of 33.7% over the last three years.
In the fiscal 2022 third quarter ended October 2, 2022, UTZ’s net sales increased 16% year-over-year to $362.80 million. The increase in net sales was driven by Organic Net Sales growth of 12.6% and acquisitions of 4.7%. Its adjusted gross profit grew 18.6% from the prior-year period to $132.60 million. The company’s adjusted EBITDA came in at $47.70 million, up 6.5% year-over-year.
Furthermore, UTZ raised its full-year 2022 outlook. It increased its total net sales growth outlook from 13-15% to 17-19% and its Organic Net Sales growth outlook from 10-12% to 13-15%. The improved guidance for net sales growth reflects the company’s year-to-date performance and continued business momentum.
In addition, for fiscal 2022, the company raised its adjusted EBITDA outlook from 2-5% growth to an updated range of $166 million to $170 million, or 6-9% compared to the prior year.
Analysts expect UTZ’s revenue of $336.21 million for the fiscal 2022 fourth quarter (ending December 31, 2022), indicating an increase of 11.7% year-over-year. The company’s EPS for the current quarter is expected to grow 8% year-over-year to $0.12. Furthermore, the company has surpassed the consensus revenue estimates in each of the trailing four quarters.
UTZ is currently trading at a premium, indicating high expectations regarding the company’s performance in the upcoming quarters. Regarding forward non-GAAP P/E, UTZ is trading at 34.03x, 82.1% higher than the industry average of 18.69x. Likewise, its forward EV/Sales multiple of 2.29 compares to the industry average of 1.71.
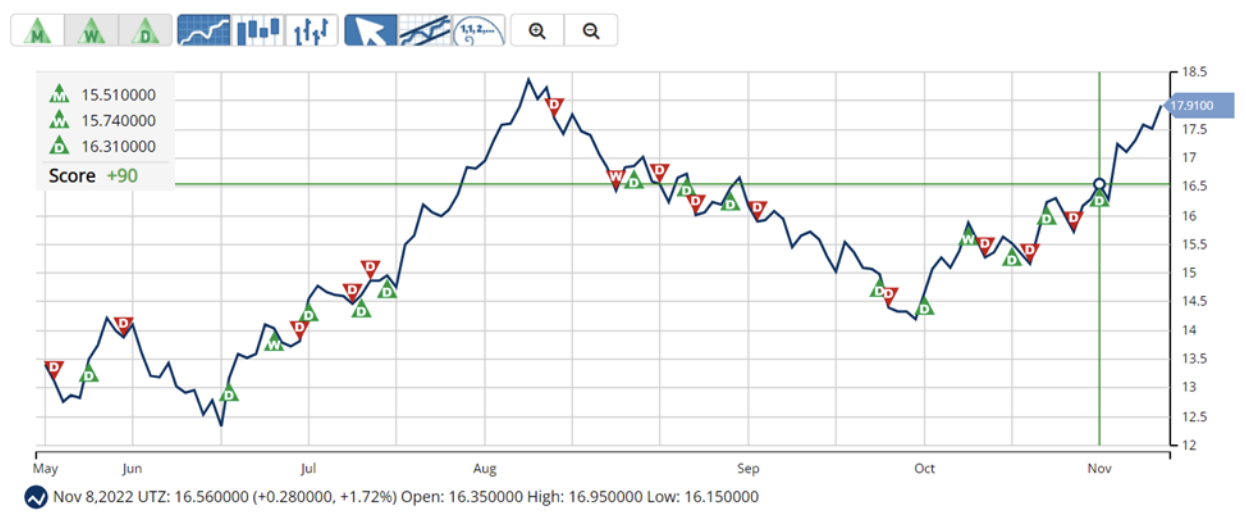
The stock is currently trading above its 50-day and 200-day moving averages of $15.73 and $15.17, respectively, indicating an uptrend. It has gained 26.5% over the past six months to close the last trading session at $17.91.
MarketClub's Trade Triangles show that UTZ has been trending UP for all the three-time horizons. The long-term trend for UTZ has been UP since July 20, 2022, while its intermediate-term and short-term trends have been UP since October 18, 2022, and November 8, 2022, respectively.
The Trade Triangles are our proprietary indicators, comprised of weighted factors that include (but are not necessarily limited to) price change, percentage change, moving averages, and new highs/lows. The Trade Triangles point in the direction of short-term, intermediate, and long-term trends, looking for periods of alignment and, therefore, intense swings in price.
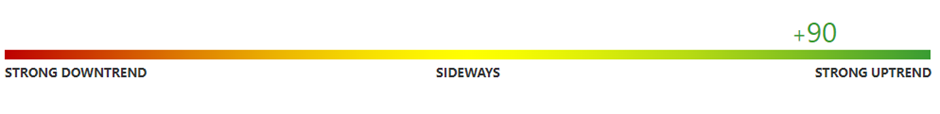
In terms of the Chart Analysis Score, another MarketClub proprietary tool, UTZ scored +90 on a scale from -100 (strong downtrend) to +100 (strong uptrend), indicating that the uptrend will likely continue. While UTZ shows intraday weakness, it remains in the confines of a bullish trend.
The Chart Analysis Score measures trend strength and direction based on five different timing thresholds. This tool considers intraday price action; new daily, weekly, and monthly highs and lows; and moving averages.
Click here to see the latest Score and Signals for UTZ.
Westrock Coffee Company, LLC (WEST)
WEST is the leading coffee, tea, and extract service provider in the United States, providing sourcing and financing, roasting, packaging, and distribution services to retailers, convenience stores, and hospitality customers worldwide. The company operates through Beverage Solutions and Sustainable Sourcing and Traceability segments. It has a market capitalization of $933.38 million.
For the fiscal 2022 third quarter ended September 30, 2022, WEST’s net sales increased 27% year-over-year to $230.30 million due to an increase in single-serve cup volume and a rise in underlying green coffee prices, partially offset by a decrease in roast and ground coffee volumes. The company’s gross profit grew 7% year-over-year to $41.10 million. Its income from operations came in at $5.50 million, up 36% year-over-year.
In addition, the company’s adjusted EBITDA increased 33% from the year-ago value to $17.90 million, driven by increased gross profit, coupled with improved expense management, primarily driven by personnel cost savings, partially offset by higher professional fees.
Analysts expect WEST’s revenue for the fiscal year (ending December 2023) to come in at $957.84 million, representing an increase of 9.7% year-over-year. The consensus EPS estimate of $0.25 for the next year indicates a 406.7% year-over-year increase.
Shares of WEST have gained 29% over the past month to close the last trading session at $12.78. The stock is currently trading above its 50-day and 200-day moving averages of $10.59 and $10.15, respectively, indicating an uptrend.
MarketClub's Trade Triangles show that WEST has been trending UP for all the three-time horizons. The long-term trend for WEST has been UP since November 11, 2022, while its intermediate-term and short-term trends have been UP since October 28, 2022, and November 4, 2022, respectively.
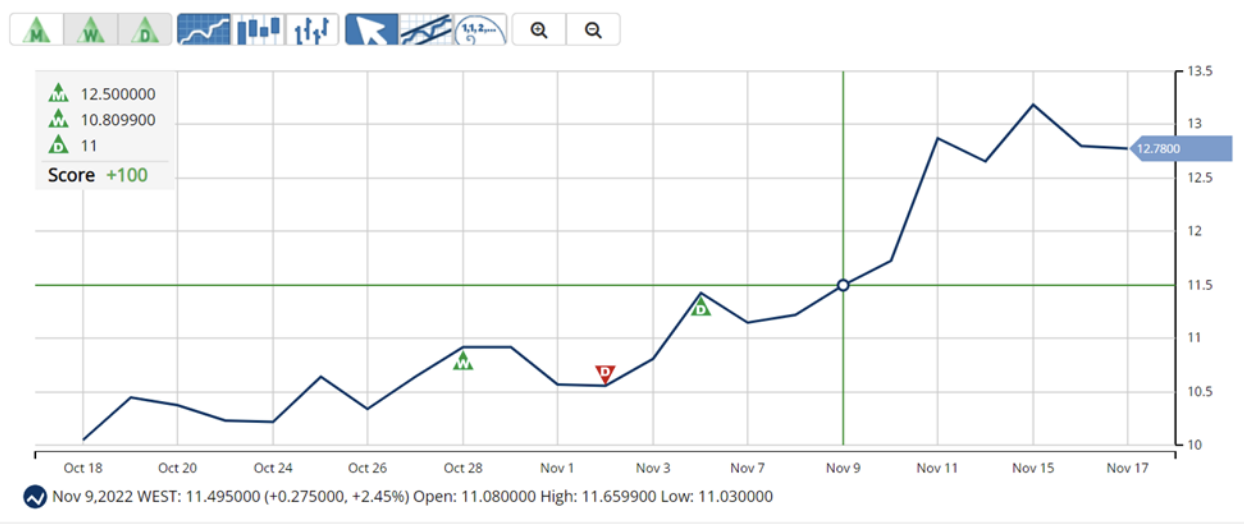
In terms of the Chart Analysis Score, WEST scored +100 on a scale from -100 (strong downtrend) to +100 (strong uptrend), indicating that the uptrend will likely continue. Traders should protect gains and look for a change in score to suggest a slowdown in momentum.

Click here to see the latest Score and Signals for WEST.
What's Next for These Stocks?
Remember, the markets move fast and things may quickly change for these stocks. Our MarketClub members have access to entry and exit signals so they'll know when the trend starts to reverse.
Join MarketClub now to see the latest signals and scores, get alerts, and read member-exclusive analysis for over 350K stocks, futures, ETFs, forex pairs and mutual funds.
Best,
The MarketClub Team
su*****@in*.com
Can you please show me how to create the above chart that shows D W M trader triangles for the chosen period of time? Appreciate.