
It has been a challenging year for the stock market as most equities have witnessed a sell-off due to various macroeconomic and geopolitical concerns.
However, retail energy and renewable energy solutions provider Genie Energy Ltd. (GNE) has gained 84.7% in price year-to-date and 90.6% over the past year to close the last trading session at $10.29.
The stock’s strong performance can be attributed to the rise in energy prices that led to strong earnings for the company.
Post its third-quarter earnings, GNE’s CEO Michael Stein, said, “We reported record third-quarter profit metrics driven by strength in Genie Retail Energy (GRE), our domestic retail energy business. GRE continued to outperform in a volatile energy price environment. We were well-positioned with our customer book and hedges heading into the quarter and were able to drive a 54% gross margin and generate nearly $28 million in Adjusted EBITDA.”
Its Genie Renewables (GREW) segment also did well as it acquired site rights to 64MW solar projects and advanced them through its permitting processes.
“Given the challenging environment in the European energy market, we determined that the risk was beyond our acceptable tolerances. As a result, we exited our remaining international retail operations and no longer serve customers in Scandanavia,” he added.
GNE is trading at a discount to its peers. In terms of trailing-12-month GAAP P/E, GNE's 5.44x is 73.5% lower than the 20.53x industry average. Its trailing-12-month EV/S of 0.55x is 86.4% lower than the 4.05x industry average. Also, the stock's 2.07x trailing-12-month EV/EBITDA is 84.4% lower than the 13.30x industry average.
On November 30, 2022, GNE announced the acquisition of a portfolio of residential and small commercial customer contracts from Mega Energy. GNE’s CEO Michael Stein said, “Our strong balance sheet, with significant cash reserves, positions us to compete for additional books of business at favorable prices. We will continue to look for customer acquisition opportunities as specific markets become more conducive to growth.”
The acquisition helps it acquire new customers across seven states in the Northeast and Midwest. The portfolio comprises approximately 11,000 residential and commercial customer meters, and it is expected to be revenue and earnings accretive for the company immediately.
For the rest of the year, Stein guided, “We expect energy prices to remain volatile as we head into the winter months, but we continue to be well-positioned from a risk management position and will return to customer acquisition mode on a market-by-market basis when the risk/reward balance is favorable.”
“Additionally, we expect to receive all approvals necessary to begin construction on our first wholly-owned and operated solar generation project this quarter. Finally, we continue to redeem our preferred stock to enhance our flexibility to invest future cash-flows in value creation initiatives, including pursuing additional growth opportunities in our renewable business,” he added.
Here's what could influence GNE’s performance in the upcoming months:
Mixed Financials
GNE’s revenue declined 7.3% year-over-year to $81.28 million for the third quarter ended September 30, 2022.
Its adjusted EBITDA increased 35.4% year-over-year to $24.50 million. The company’s gross margin came in at 53.1%, compared to 39.5% in the prior-year period.
Also, its net income attributable to GNE common stockholders came in at $18.31 million, compared to a net loss attributable to GNE common stockholders of $2.66 million in the year-ago period.
High Profitability
In terms of the trailing-12-month gross profit margin, GNE’s 49.45% is 26.9% higher than the 38.98% industry average.
Likewise, its 26.20% trailing-12-month EBIT margin is 40.8% higher than the industry average of 18.61%. Furthermore, the stock’s 1.52% trailing-12-month asset turnover ratio is 552.6% higher than the industry average of 0.23%.
Technical Indicators Show Promise
According to MarketClub’s Trade Triangles, the long-term and short-term trends for GNE have been UP since December 14, 2022, and its intermediate-term trend has been UP since December 5, 2022.
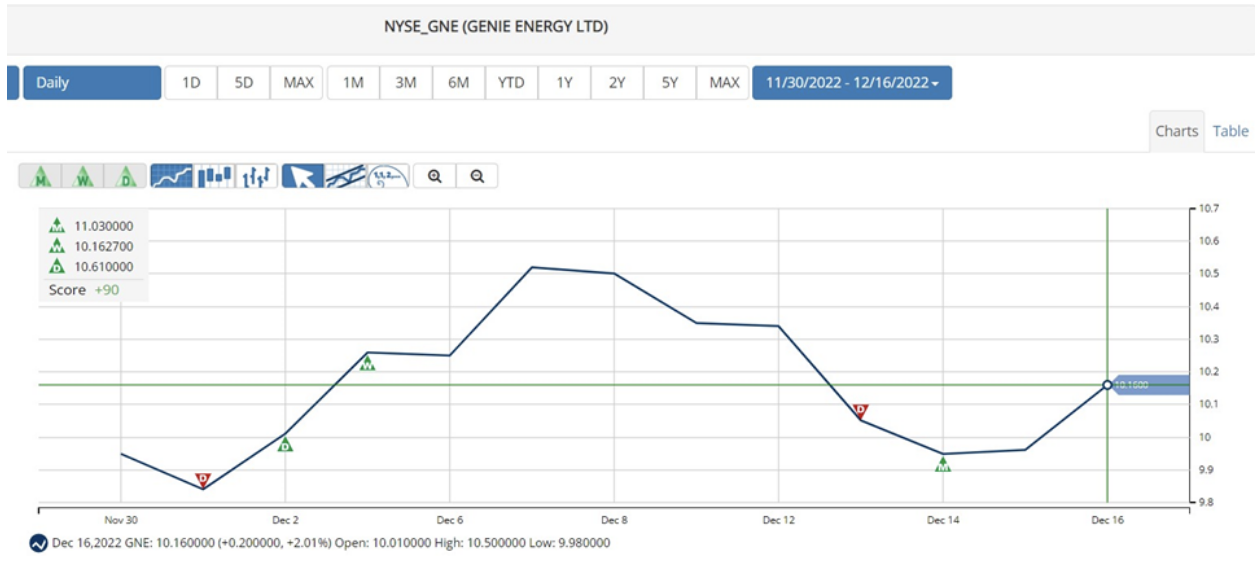
The Trade Triangles are our proprietary indicators, comprised of weighted factors that include (but are not necessarily limited to) price change, percentage change, moving averages, and new highs/lows. The Trade Triangles point in the direction of short-term, intermediate, and long-term trends, looking for periods of alignment and, therefore, intense swings in price.
In terms of the Chart Analysis Score, another MarketClub proprietary tool, GNE, scored +85 on a scale from -100 (strong downtrend) to +100 (strong uptrend), indicating short-term weakness. However, look for the longer-term bullish trend to resume. As always, continue to monitor the trend score and utilize a stop order.

The Chart Analysis Score measures trend strength and direction based on five different timing thresholds. This tool takes into account intraday price action, new daily, weekly, and monthly highs and lows, and moving averages.
Click here to see the latest Score and Signals for GNE.
What's Next for Genie Energy Ltd. (GNE)?
Remember, the markets move fast and things may quickly change for this stock. Our MarketClub members have access to entry and exit signals so they'll know when the trend starts to reverse.
Join MarketClub now to see the latest signals and scores, get alerts, and read member-exclusive analysis for over 350K stocks, futures, ETFs, forex pairs and mutual funds.
Best,
The MarketClub Team
su*****@in*.com