
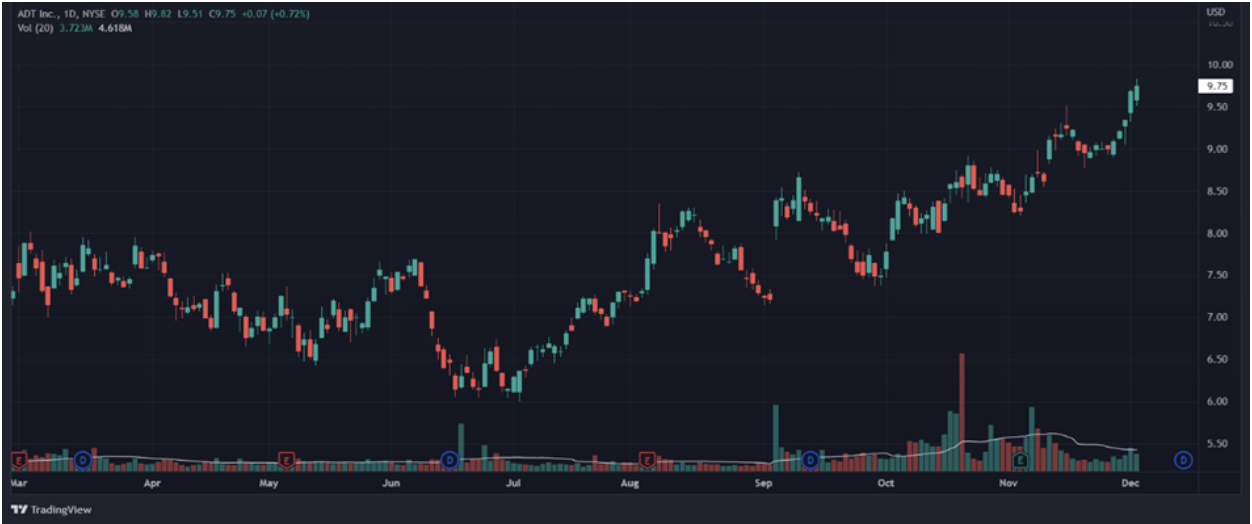
Provider of security, interactive, and smart home solutions ADT Inc. (ADT) hit a new 52-week high of $9.82 on December 2, 2022. ADT’s stock has gained 15.9% in price year-to-date and 16.9% over the past year to close the last trading session at $9.64.
ADT’s EPS and revenue surpassed the consensus estimates in the last quarter. Its EPS came 52.1% higher than analyst estimates, while its revenue beat the consensus estimate by 0.6%. Higher revenues from the CSB, Commercial, and ADT Solar segments drove revenues higher.
Total CSB revenue increased 7% year-over-year to $1.11 billion in the third quarter, while its total Commercial revenue rose 12% year-over-year to $314 million. Furthermore, ADT’s Solar segment contributed $179 million to its total revenue.
ADT’s President and CEO, Jim DeVries, said, “ADT’s strong third-quarter results demonstrate our continued momentum – setting records in customer retention, RMR balance, and revenue payback. Our performance to date validates our progress on key initiatives, outlined earlier this year during our Investor Day, to meaningfully grow revenue, earnings, and cash flows, as well as reduce debt.”
On September 6, 2022, ADT announced that State Farm would make an equity investment of $1.20 billion in ADT, resulting in State Farm owning approximately 15% of ADT. ADT also announced a new partnership with State Farm to expand opportunities to combine next-generation security, innovative smart home technology, and reimagined risk-mitigation capabilities to monitor, detect, prevent, and minimize homeownership risks.
Post the announcement, the stock had a gap-up opening and has not looked back since.
State Farm will also invest up to $300 million in an opportunity fund to support product innovation, technology, and marketing that seeks to differentiate and improve the customer experience for homeowners.
The deal will help ADT reach new consumers with its various security products. ADT’s President and CEO, Jim DeVries, said, “These new and expanded partnerships represent another bold step forward for our company and provide ADT more avenues to grow our customer base, strengthen brand loyalty, and lower customer acquisition costs.”
After its third-quarter earnings release, DeVries added, “Additionally, we were tremendously excited to announce our partnership with State Farm. A collaboration with such a marquee organization will serve as a significant future growth catalyst for ADT, and we look forward to continued positive momentum in 2023.”
For fiscal 2022, ADT expects its total revenue to be between $6.20 billion and $6.40 billion. Its adjusted EBITDA is expected to come between $2.33 billion to $2.43 billion and adjusted free cash flow between $550 million to $625 million.
This State Farm deal is the second key deal signed by Jim DeVries. In September 2020, ADT secured a $450 million investment from Google. As part of the partnership with Google, ADT sells, installs, and services a full suite of Google Nest products, including doorbells, cameras, and thermostats.
Post the State Farm investment; Google will be a 6% holder in ADT. Subject to fulfilling certain milestones, Google has committed $150 million to the company, raising its total success fund commitment with ADT to $300 million.
Incremental funds will enable ADT to expand its access for more customers to smart home innovation and technologies via new sales programs and other activities.
Here’s what could influence ADT’s performance in the upcoming months:
Robust Financials
ADT’s total revenue increased 21.8% year-over-year to $1.60 billion for the third quarter ended September 30, 2022.
The company’s adjusted EBITDA increased 11.9% year-over-year to $620 million. Its net cash provided by operating activities increased 34.6% year-over-year to $498 million. In addition, its free cash flow increased 133.9% year-over-year to $145 million.
Also, its adjusted net income came in at $83 million, compared to an adjusted net loss of $54 million in the prior-year quarter. Its adjusted EPS came in at $0.10, compared to an adjusted loss per share of $0.07 in the year-ago period.
Favorable Analyst Estimates
ADT’s EPS for fiscal 2022 and 2023 is expected to increase 304% and 49% year-over-year to $0.51 and $0.76, respectively.
Its revenue for fiscal 2022 and 2023 is expected to increase 20% and 7.8% year-over-year to $6.37 billion and $6.86 billion, respectively.
Mixed Profitability
ADT’s trailing-12-month net income margin is negative, compared to the 5.05% industry average. Its 0.37% trailing-12-month asset turnover ratio is 64% lower than the industry average of 1.01%.
On the other hand, its 68.56% trailing-12-month gross profit margin is 92.7% higher than the 35.59% industry average. Also, its 37.65% trailing-12-month EBITDA margin is 239.5% higher than the 11.09% industry average.
Mixed Valuation
In terms of forward EV/S, ADT’s 2.93x is 164% higher than the 1.11x industry average. Likewise, its 1.38x forward P/S is 57.4% higher than the 0.88x industry average.
On the other hand, its forward P/B of 2.54x is 8.8% lower than the 2.79x industry average. Its 7.71x EV/EBITDA is 17.7% lower than the 9.37x industry average.
Technical Indicators Show Promise
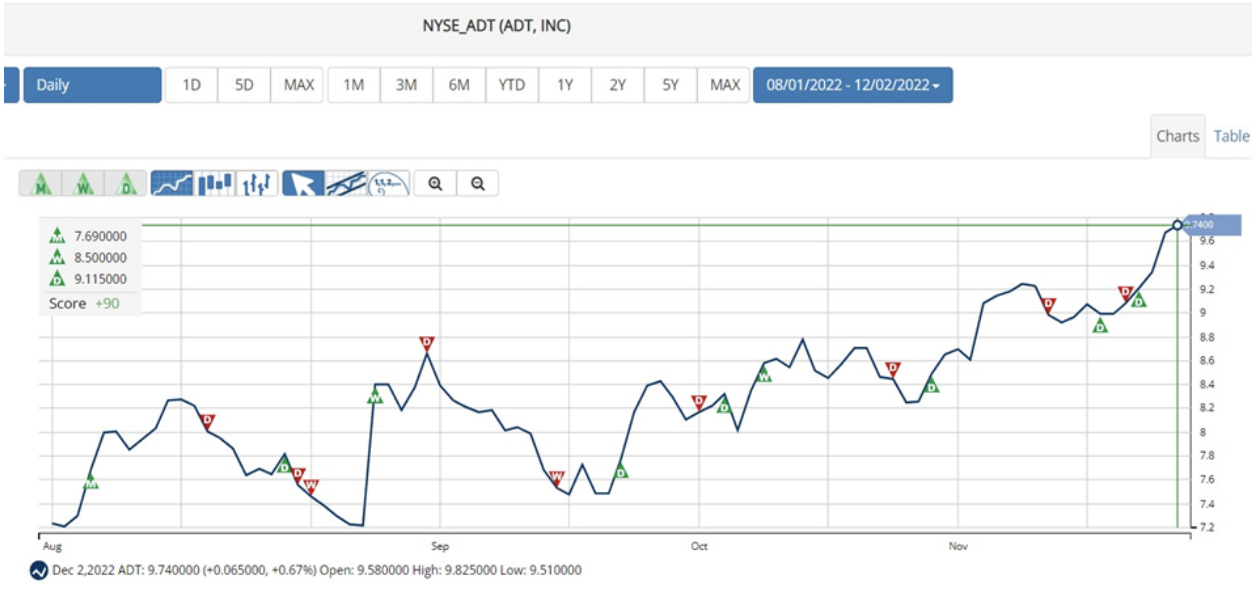
According to MarketClub’s Trade Triangles, the long-term trend for ADT has been UP since August 4, 2022, and its intermediate-term trend has been UP since October 18, 2022. In addition, the stock’s short-term trend has been UP since November 29, 2022.
The Trade Triangles are our proprietary indicators, comprised of weighted factors that include (but are not necessarily limited to) price change, percentage change, moving averages, and new highs/lows. The Trade Triangles point in the direction of short-term, intermediate, and long-term trends, looking for periods of alignment and, therefore, intense swings in price.
In terms of the Chart Analysis Score, another MarketClub proprietary tool, ADT scored +90 on a scale from -100 (strong downtrend) to +100 (strong uptrend), indicating that the uptrend is likely to continue. While ADT is showing signs of intraday weakness, it remains in the confines of a bullish trend. Traders should use caution and utilize a stop order.
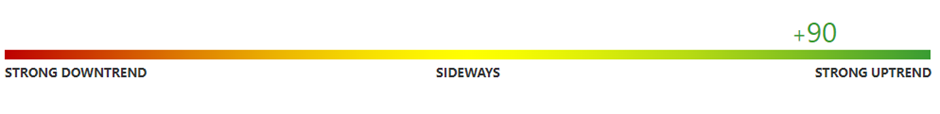
The Chart Analysis Score measures trend strength and direction based on five different timing thresholds. This tool considers intraday price action; new daily, weekly, and monthly highs and lows; and moving averages.
Click here to see the latest Score and Signals for ADT.
What's Next for ADT Inc. (ADT)?
Remember, the markets move fast and things may quickly change for this stock. Our MarketClub members have access to entry and exit signals so they'll know when the trend starts to reverse.
Join MarketClub now to see the latest signals and scores, get alerts, and read member-exclusive analysis for over 350K stocks, futures, ETFs, forex pairs and mutual funds.
Best,
The MarketClub Team
su*****@in*.com