
Back in September, I shared with you my take on the USDJPY currency pair based on 360° view. A combination of fundamental factors and technical factors has supported the continued strength of the U.S. dollar relative to the Japanese yen.
However, the majority of readers predicted the opposite, as you can see in the screenshot below.
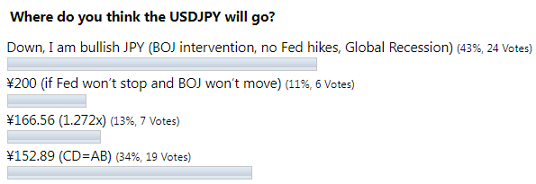
As the second largest vote played out the best, the USDJPY has soared more than six percent to reach a peak of ¥151.94. The previous time this level appeared on this chart was in the summer of distant 1990, two decades ago. That move was close to hit the CD=AB target at ¥152.89, however it has lost the momentum.
The pair has lost more than it gained in that call and there is a question, is that all or are we just in a large correction?
I prepared for you another bunch of visualizations below to answer that question.
Let’s start with the fundamentals first in the interest rate comparison below.
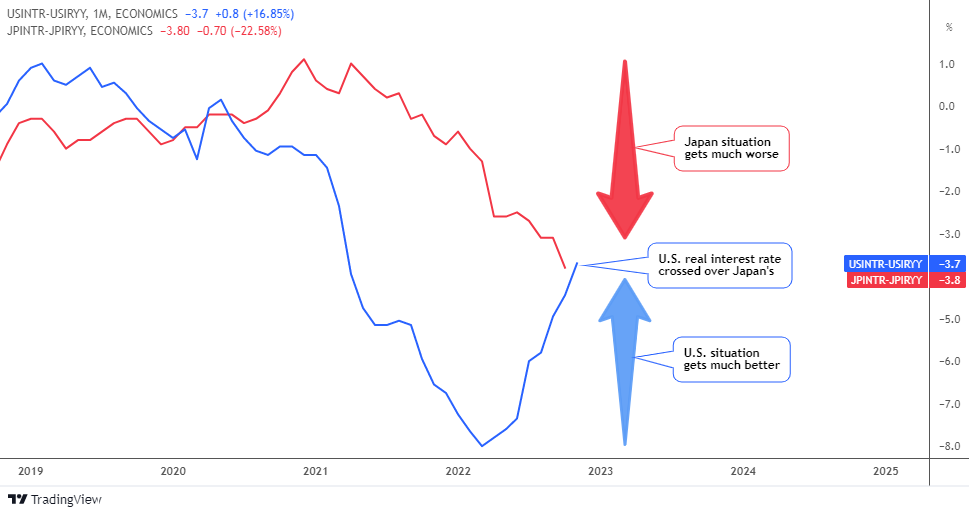
The Federal Reserve is actively trying to control inflation by raising interest rates at each and every meeting. As a result, the real interest rate in the U.S. has soared from negative minus 8 percent this spring up to the current level of minus 3.7 percent.
It contrasts with the “let it be” approach of the Bank of Japan. Hence, the Japanese real interest rate has been sinking lower and lower to finally cross the U.S. real interest rate as shown in the chart above.
The margin is only 0.1 percent and it could probably rise by 0.5 percent this week at the Fed meeting. This makes U.S. assets more attractive, which will boost dollar demand.
The next chart shows the current market distortion that is clear as day.
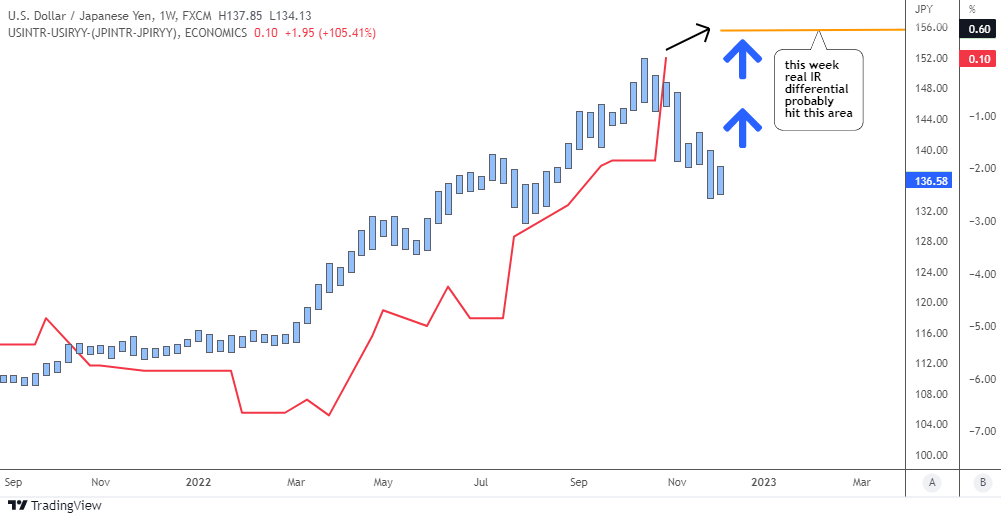
Last time, we had the opposite situation – the USDJPY pair was above the real interest rate differential between the U.S. and Japan (red line) due to market forecasts of further Fed hikes. This indicator works perfectly, as we can see how USDJPY peaked right at the current maximum of the interest rate differential.
These days the market is far below the red line. The orange line highlights the area where the Fed could raise the differential this week. It corresponds to USDJPY levels between ¥155 and ¥156, which indicates significant growth potential of almost 14% for the pair.
Let us move to the technical chart below to complete 360° view.
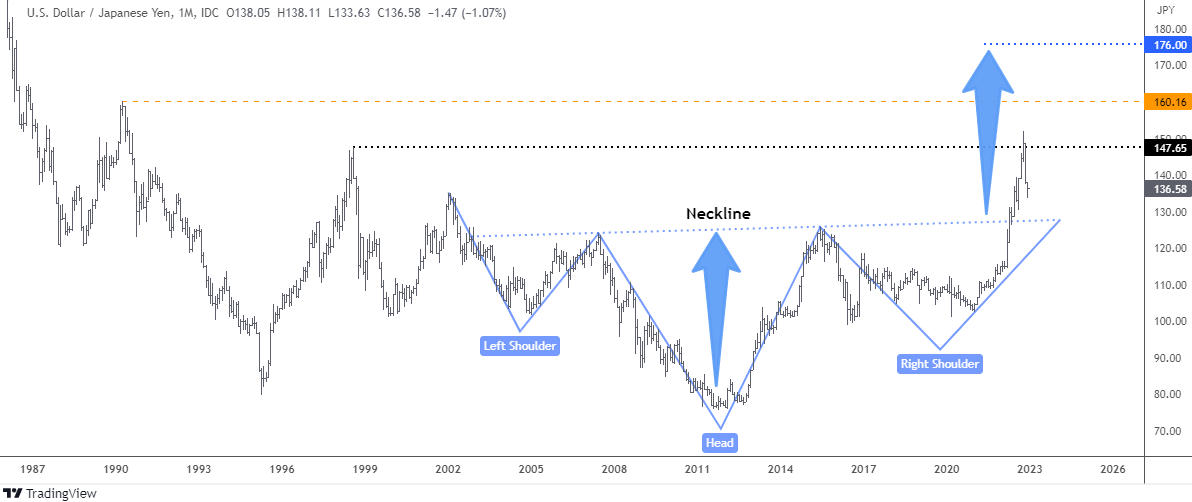
This time I zoomed out the view enough to spot the huge Inverse Head & Shoulders pattern (blue) in the monthly chart above. It is a bullish reversal pattern and its magnitude is fortified by the up-sloping right shoulder.
This April the price had broken above the trigger of the Neckline around ¥127.5. The follow-up move to the upside was unstoppable until it reached the next black barrier of August 1998 close to ¥148. The USDJPY spiked above that level and then collapsed swiftly below it.
A target for this pattern is at the height of the Head added to the Neckline at ¥176. It should be a tremendous gain of almost 29 percent from last week’s close of ¥136.58.
The barriers to watch are located at the peak of 1998 above ¥147 (black) and at the maximum of 1990 around ¥160 (orange).
If the pair is to maintain bullish momentum, then it needs to stay above the Neckline around ¥127.
Intelligent trades!
Aibek Burabayev
INO.com Contributor
Disclosure: This contributor has no positions in any stocks mentioned in this article. This article is the opinion of the contributor themselves. The above is a matter of opinion provided for general information purposes only and is not intended as investment advice. This contributor is not receiving compensation (other than from INO.com) for their opinion.