
Amid macroeconomic and geopolitical headwinds, energy stocks have fared better than the broader market this year.
The war between Ukraine and Russia had led to a significant rise in prices of crude oil and natural gas as the world feared a shortage of these essential commodities with widespread sanctions on Russia, a major oil and gas producer. This led to investors’ focus shifting to energy stocks.
Oil and gas major TotalEnergies SE (TTE) has gained 29.8% in price year-to-date and 27% over the past year to close the last trading session at $63.13. Courbevoie, a France-based company, announced a solid third-quarter performance.
The company’s iGRP segment reported a record adjusted net operating income of $3.60 billion in the quarter, rising $1.10 billion sequentially, and cash flow of $2.70 billion, driven by increase in average LNG selling price.
TTE’s CEO Patrick Pouyanné said, “In a context marked by an average Brent price of $100/b and an increase in gas prices exacerbated by Russia’s military aggression in Ukraine, TotalEnergies leveraged its integrated model, particularly LNG, to generate results in line with previous quarters.”
TTE announced that it had obtained a 9.375% participating interest in the 16 million ton per annum (Mtpa) North Field South (NFS) LNG project in Qatar to fuel its growth further.
After combining its participating interest in North Field East (NFE) with NFS, TTE will add LNG production of 3.5 Mtpa to its worldwide LNG portfolio by 2028, which is in line with its goal to increase natural gas in its sales mix to 50% by 2030.
During the previous quarter, the company also announced that production had started at the Ikike field in Nigeria. The project is expected to deliver peak production of 50,000 barrels of oil equivalent per day by the end of this year.
TTE also launched the Begonia project in Angola and the Fenix project in Argentina, which is expected to produce 10 million cubic meters per day of natural gas after the expected operations in early 2025.
Moreover, the company’s partner Eni announced in August that it had made a significant gas discovery in the Cronos-1 well in Cyprus, with initial estimates indicating 2.5 TCF of gas.
Furthermore, it completed the acquisition of 50% of the Clearway Energy Group in the U.S. and acquired an interest in developing more than 12 GW of onshore solar and wind projects in Brazil.
For the fourth quarter, TTE expects production to reach around 2.8 Mboe/d due to a reduction in planned maintenance and restart of Kashagan production. It expects the average LNG selling price will be above $17/Mbtu.
Despite the anticipated slowdown in the global economy next year, the company believes that oil prices will be supported by the OPEC+ decision to reduce production by 2 million barrels per day and the European Union’s ban on Russian oil earlier this month.
Gas prices are expected to remain high due to the ban on Russian gas imports in Europe.
Moreover, refining margins are expected to remain strong due to the ban on the import of Russian petroleum products in Europe, effective from February 2023.
Here's what could influence TTE’s performance in the upcoming months:
Robust Financials
TTE’s revenue from sales increased 32.4% year-over-year to $64.96 billion for the third quarter ended September 30, 2022. Its adjusted net operating income from business segments increased 91.3% year-over-year to $10.28 billion.
The company’s adjusted net income rose 106.8% year-over-year to $9.86 billion. Its adjusted EPS came in at $3.83, representing an increase of 117.6% year-over-year. In addition, its adjusted EBITDA increased 73.7% year-over-year to $19.42 billion.
Mixed Analyst Estimates
Analysts expect TTE’s EPS and revenue for fiscal 2022 to increase 113.7% and 39.6% year-over-year to $14.27 and $257.69 billion, respectively. Its EPS and revenue for fiscal 2023 are expected to decline 12.4% and 10.7% year-over-year to $12.50 and $230.17 billion, respectively.
Discounted Valuation
In terms of forward non-GAAP P/E, TTE's 4.42x is 44% lower than the 7.90x industry average. Its forward P/S of 0.61x is 54% lower than the 1.32x industry average. Also, the stock's 2.59x trailing-12-month EV/EBITDA is 51.2% lower than the 5.31x industry average.
Mixed Profitability
In terms of the trailing-12-month EBITDA margin, TTE’s 24.46% is 21.2% lower than the 31.05% industry average. Its 6.34% trailing-12-month Capex/Sales is 41.2% lower than the 10.77% industry average.
On the other hand, its 11.85% trailing-12-month levered FCF margin is 77% higher than the industry average of 6.70%. In addition, its 0.79% trailing-12-month asset turnover ratio is 22.9% higher than the industry average of 0.64% industry average.
Technical Indicators Show Promise
According to MarketClub’s Trade Triangles, the long-term trend for TTE has been UP since October 28, 2022, and its intermediate-term trend has been UP since October 17, 2022. In addition, the stock’s short-term trend has been DOWN since December 29, 2022.
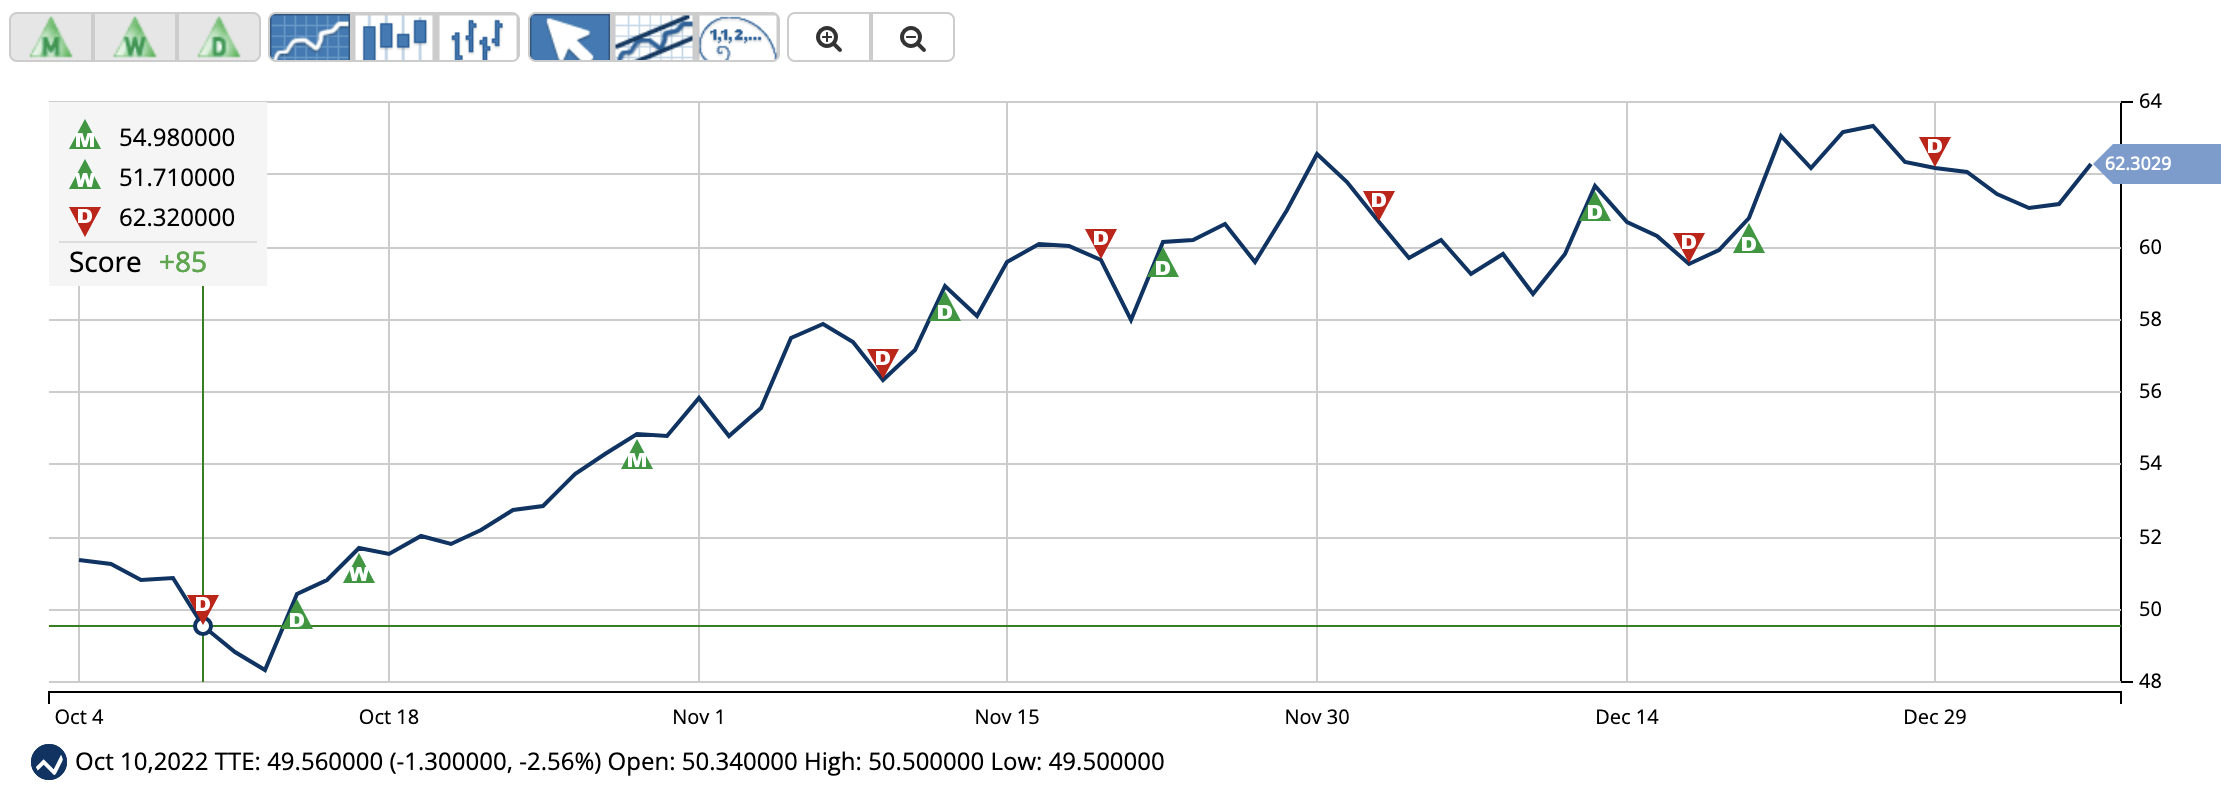
The Trade Triangles are our proprietary indicators, comprised of weighted factors that include (but are not necessarily limited to) price change, percentage change, moving averages, and new highs/lows. The Trade Triangles point in the direction of short-term, intermediate, and long-term trends, looking for periods of alignment and, therefore, intense swings in price.
In terms of the Chart Analysis Score, another MarketClub proprietary tool, TTE, scored +85 on a scale from -100 (strong downtrend) to +100 (strong uptrend), indicating that the longer-term bullish trend is likely to resume. Traders should continue to monitor the trend score and utilize a stop order.

The Chart Analysis Score measures trend strength and direction based on five different timing thresholds. This tool takes into account intraday price action, new daily, weekly, and monthly highs and lows, and moving averages.
Click here to see the latest Score and Signals for TTE.
What's Next for TotalEnergies SE (TTE)?
Remember, the markets move fast and things may quickly change for this stock. Our MarketClub members have access to entry and exit signals so they'll know when the trend starts to reverse.
Join MarketClub now to see the latest signals and scores, get alerts, and read member-exclusive analysis for over 350K stocks, futures, ETFs, forex pairs and mutual funds.
Best,
The MarketClub Team
su*****@in*.com