
According to Bankrate’s national survey of large lenders, the average rate on 30-year mortgages is 6.59%, up 12 basis points compared to this time last week.
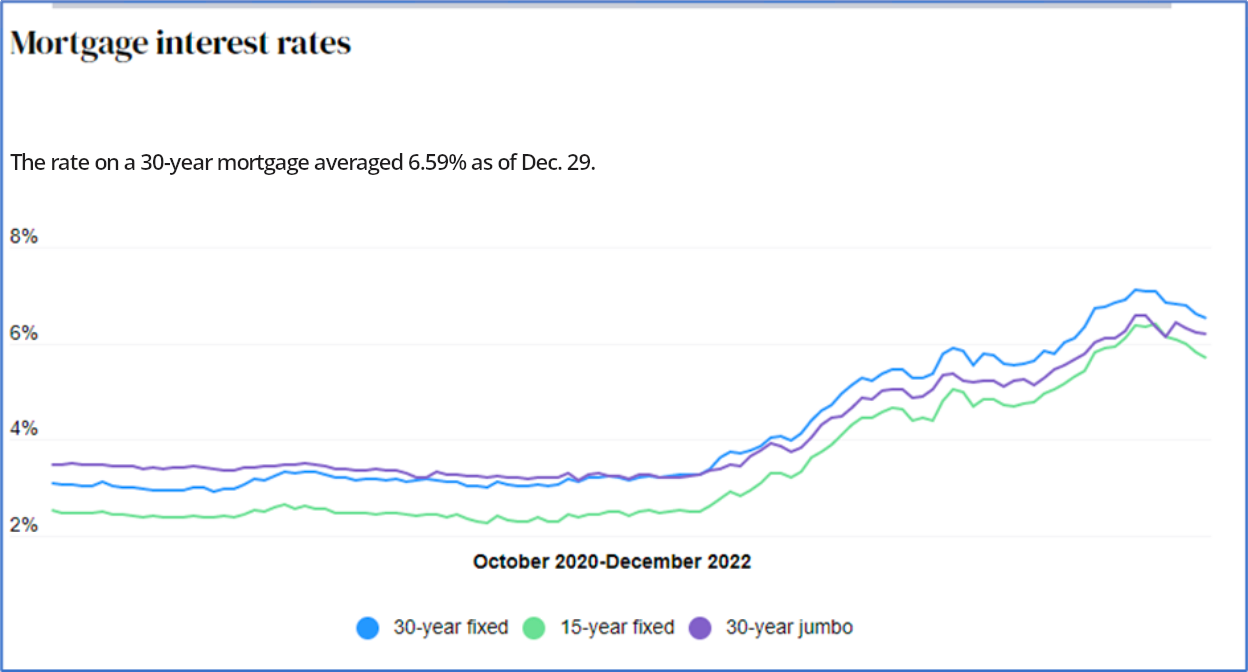
As the cumulative effects of a protracted campaign of interest rate hikes by the Fed are yet to be felt, economic growth, or lack thereof, is expected to replace inflation as the topmost concern.
Amid such a downturn, softening demand from home buyers could end up exerting downward pressure on mortgage rates, thereby restoring equilibrium.
According to Nadia Evangelou, senior economist & director of forecasting at the National Association of Realtors, “If inflation continues to decelerate over the next several months, mortgage rates will likely stabilize below 7%.”
In addition to high margin backlogs to help weather a potential slowdown, moderation of inflation, and consequently mortgage rates, would bode well for home-building stocks D.R. Horton, Inc. (DHI), Toll Brothers, Inc. (TOL), and KB Home (KBH) as some technical indicators point to sustained upsides with adequate downside protection.
D.R. Horton, Inc. (DHI)
DHI acquires and develops land to construct and sell residential homes as a home-building company. The company operates through four segments: home-building; Forestar lot development; financial services; and rental operations.
Over the last three years, DHI’s revenues have registered a 23.9% CAGR, while its EBITDA has grown at 52.7%. During the same period, the company’s net income has grown at 53.5% CAGR.
For the fiscal fourth quarter, ended September 30, 2022, DHI’s revenues increased 18.9% year-over-year to $9.64 billion.
During the same period, the net income attributable to DHI increased 21.9% year-over-year to $1.63 billion. This translated to a net income of $4.67 per share, up 24.9% year-over-year.
Analysts expect DHI’s revenue and EPS for the fiscal ending September 2024 to increase 1.5% and 5.9% year-over-year to $29.47 billion and $10.34, respectively. Moreover, DHI has topped the consensus EPS estimates in three of the trailing four quarters.
In terms of forward P/E, DHI is currently trading at 9.02x compared to the industry average of 12.05. Also, its forward EV/EBITDA multiple of 6.93 compares favorably to the industry average of 8.80, while its forward Price/Book multiple of 1.37 is significantly lower than the industry average of 2.48.
DHI’s stock is currently trading above its 50-day and 200-day moving averages of $79.48 and $74.66, respectively, indicating a bullish trend. It has gained 7.9% over the past month and 43% over the past six months to close the last trading session at $87.65.
MarketClub’s Trade Triangles show that DHI has been trending UP for two of the three time horizons. Its long-term trend has been UP since November 10, 2022, while its intermediate-term trend has been UP since October 25, 2022. Its short-term trend recently turned DOWN on December 28.

The Trade Triangles are our proprietary indicators, comprised of weighted factors that include (but are not necessarily limited to) price change, percentage change, moving averages, and new highs/lows. The Trade Triangles point in the direction of short-term, intermediate, and long-term trends, looking for periods of alignment and, therefore, strong swings in price.
In terms of the Chart Analysis Score, another MarketClub proprietary tool, DHI scored +85 on a scale from -100 (strong downtrend) to +100 (strong uptrend), indicating that the longer-term bullish trend is likely to resume. Traders should continue to monitor the trend score and utilize a stop order.

The Chart Analysis Score measures trend strength and direction based on five different timing thresholds. This tool takes into account intraday price action, new daily, weekly, and monthly highs and lows, and moving averages.
Click here to see the latest Score and Signals for DHI.
Toll Brothers, Inc. (TOL)
TOL designs, builds, markets, sells, and arranges finance for luxury residential single-family detached homes, attached homes, and master-planned resort-style golf and urban communities. Its segments include Traditional Home Building and Urban Infill (City Living).
Over the last three years, TOL’s revenues have grown at a 12.5% CAGR, while its EBITDA has grown at 26.9% CAGR. During the same period, the company’s net income has grown at 29.7% CAGR.
For the fiscal fourth quarter, ended October 31, 2022, despite the challenging macroeconomic climate due to increasing mortgage rates, TOL’s revenue increased 22.1% year-over-year to $3.71 billion, driven by strong pricing in its backlog.
During the same period, the company’s income from operations increased 56.6% year-over-year to $690.23 million, while its net income increased 71.1% to $640.54 million.
As a result, TOL’s quarterly EPS increased 86.4% year-over-year to $5.63.
Despite the softer market, TOL expects the fiscal year 2023 to be another solid, high-margin year because of its strong backlog of 8,098 homes valued at $8.9 billion at fiscal year-end. Moreover, the company has surpassed consensus EPS estimates in each of the trailing four quarters.
In terms of forward P/E, TOL is currently trading at 6.01x compared to the industry average of 12.10x. Also, its forward EV/EBITDA multiple of 5.12 compares favorably to the industry average of 8.76, while its forward Price/Book multiple of 0.81 is significantly lower than the industry average of 2.47.
TOL’s stock is currently trading above its 50-day and 200-day moving averages of $45.36 and $46.58, respectively. It has gained 10.9% over the past month and 19.1% over the past six months to close the last trading session at $50.06.
MarketClub’s Trade Triangles show that TOL has been trending UP for two of the three time horizons. The long-term trend for TOL has been UP since December 1, 2022, while its intermediate-term trend has been UP since November 10, 2022. Its short-term trend recently turned DOWN on December 28.

In terms of the Chart Analysis Score, TOL scored +85 on a scale from -100 (strong downtrend) to +100 (strong uptrend), indicating that the longer-term bullish trend is likely to resume. Traders should continue to monitor the trend score and utilize a stop order.
Click here to see the latest Score and Signals for TOL.
KB Home (KBH)
KBH builds a variety of new homes designed primarily for first-time and first move-up, as well as second-move-up and active adult homebuyers. The company operates through the home-building and financial services segment.
Over the last three years, KBHs revenue has grown at a 15.2% CAGR, while its EBITDA has grown at a 43.5% CAGR. During the same period, the company’s net income has grown at 47.3% CAGR.
For the third quarter of the fiscal year ended August 31, 2022, KBH’s total revenues increased 25.8% year-over-year to $1.85 billion.
During the same period, the company’s net income increased 70.1% year-over-year to $255.33 million or $2.86 per share, up 78.8% year-over-year.
Analysts expect KBH’s revenue and EPS for fiscal 2022 to increase 21.4% and 56.6% year-over-year to $6.95 billion and $9.52, respectively. Moreover, the company has also impressed by surpassing consensus EPS estimates in each of the trailing four quarters.
KBH is trading at a discount compared to its peers. In terms of the forward P/E, the stock is currently trading at 3.29x, compared to the industry average of 12.10x.
Also, its forward EV/EBITDA multiple of 3.51 compares to the industry average of 8.76. In terms of the forward Price/Book multiple, the stock is trading at 0.74, significantly lower than the industry average of 2.47.
Despite its attractive valuation, KBH’s stock is trading above its 50-day and 200-day moving averages of $29.61 and $31.07, respectively, indicating a bullish trend. The stock has gained 5.1% over the past month and 22.5% over the past six months to close the last trading session at $31.36.
MarketClub’s Trade Triangles show that KBH has been trending UP for two of the three-time horizons. The long-term trend for KBH has been UP since December 1, 2022, while its intermediate-term trend has been UP since October 25, 2022.
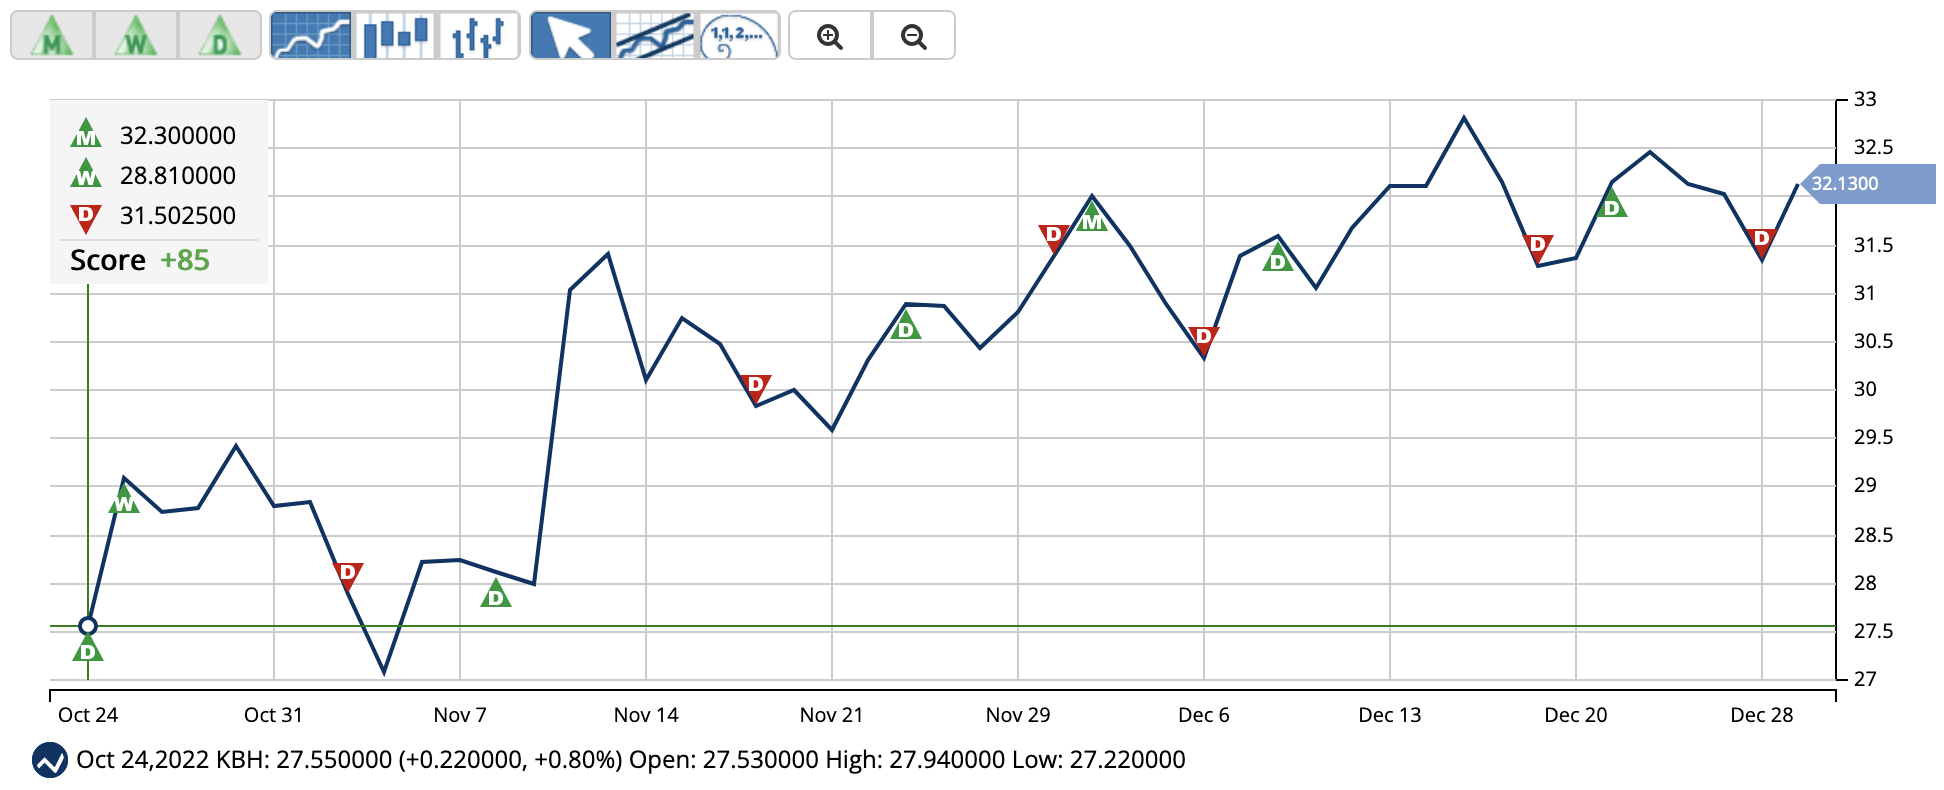
In terms of the Chart Analysis Score, KBH scored +85 on a scale from -100 (strong downtrend) to +100 (strong uptrend), indicating that the longer-term bullish trend is likely to resume. Traders should continue to monitor the trend score and utilize a stop order.
Click here to see the latest Score and Signals for KBH.
What's Next for These Homebuilder Stocks?
Remember, the markets move fast and things may quickly change for these stocks. Our MarketClub members have access to entry and exit signals so they'll know when the trend starts to reverse.
Join MarketClub now to see the latest signals and scores, get alerts, and read member-exclusive analysis for over 350K stocks, futures, ETFs, forex pairs and mutual funds.
Best,
The MarketClub Team
su*****@in*.com