
The stock market started the year on a positive note after a year filled with macroeconomic and geopolitical challenges.
The rally was driven by the Federal Reserve’s smallest rate increase since the beginning of the monetary policy tightening in March 2022 and Fed Chair Jerome Powell’s acknowledgment that inflation was showing encouraging signs.
However, investor sentiment has taken a hit lately as minutes from the central bank’s monetary policy meeting indicated that the rate hikes will not end anytime soon. The Fed officials believe interest rates need to increase and stay elevated until inflation reaches 2%.
The officials’ resolve was backed by the 0.6% sequential and 5.4% year-over-year rise in the Personal Consumption Expenditure (PCE) and the hotter-than-expected jobs report. The market expects the Fed to raise the fund rate beyond 5% this year.
However, JPMorgan CEO Jamie Dimon believes a soft landing is “still possible.” Goldman Sachs believes the chances of the American economy slipping into a recession are now just 25%, down from its previous estimate of 35%. Moreover, President Joe Biden recently said he believes the U.S. economy will not fall into a recession this year or next.
Given this backdrop, it could be wise to make the most of the strong uptrend in fundamentally strong stocks, The Hershey Company (HSY), Acuity Brands, Inc. (AYI), and Flowers Foods, Inc. (FLO).
The Hershey Company (HSY)
HSY engages in the manufacture and sale of confectionery products and pantry items. The company operates through three segments: North America Confectionery, North America Salty Snacks, and International.
It offers chocolate and non-chocolate confectionery products; gum and mint refreshment products, including mints, chewing gums, and bubble gums; pantry items, baking ingredients, toppings, beverages, and sundae syrups; and snack items.
On November 10, 2022, HSY announced that it would build a 250,000-square-foot chocolate facility in Hershey, Pa. The facility would support the production capabilities of its popular brands like Reese’s, Kit Kat, and Hershey’s. The expansion would enable the company to meet the fast-growing demand.
In terms of the trailing-12-month levered FCF margin, HSY’s 12.18% is 382.1% higher than the 2.53% industry average. Its 4.99% trailing-12-month Capex/Sales is 56.5% higher than the 3.19% industry average. Likewise, its 0.98x trailing-12-month asset turnover ratio is 16.8% higher than the industry average of 0.84x.
In terms of forward EV/S, HSY’s 4.78x is 188.9% higher than the 1.66x industry average. Its 11.89x forward P/B is 301.8% higher than the 2.96x industry average. Likewise, its 4.37x forward P/S is 278.8% higher than the 1.15x industry average.
For the fiscal fourth quarter ended December 31, 2022, HSY’s net sales increased 14% year-over-year to $2.65 billion. Its non-GAAP gross profit increased 14.6% year-over-year to $1.16 billion. The company’s non-GAAP operating profit rose 16.7% year-over-year to $555.35 million. Also, its non-GAAP net income increased 18.6% year-over-year to $417.11 million.
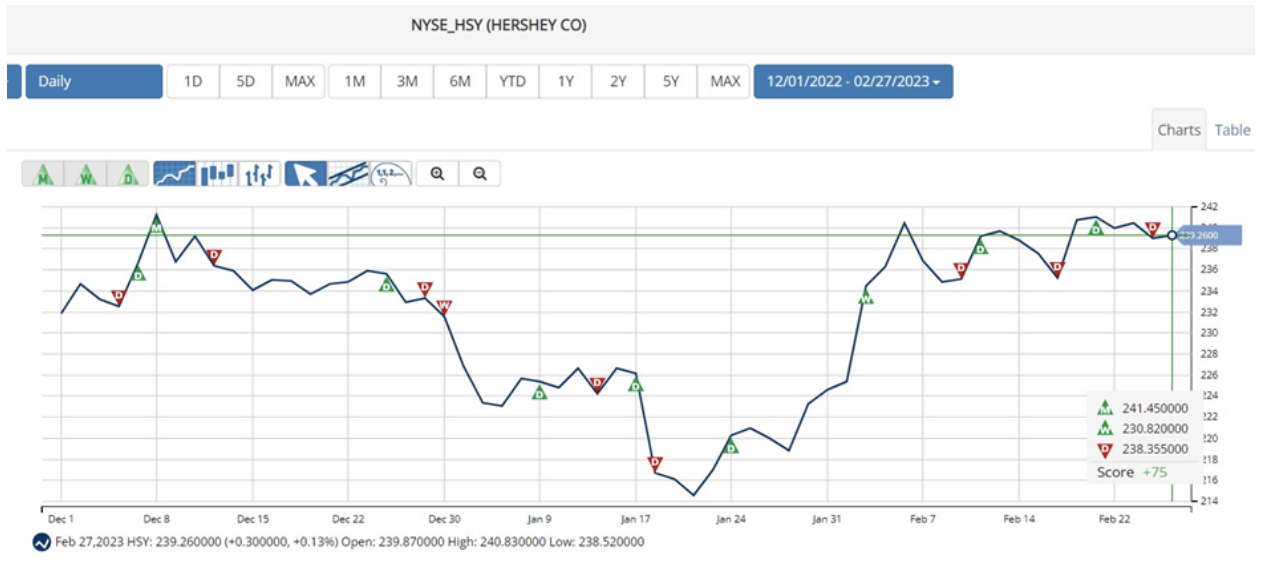
Analysts expect HSY’s EPS and revenue for the quarter ending March 31, 2023, to increase 5.7% and 8.5% year-over-year to $2.67 and $2.89 billion, respectively. It surpassed Street EPS estimates in each of the trailing four quarters. Over the past year, the stock has gained 17.1% to close the last trading session at $239.22.
HSY’s stock is trading above its 50-day and 200-day moving averages of $230.59 and $225.23, respectively, indicating an uptrend.
According to MarketClub’s Trade Triangles, HSY’s long-term trend has been UP since December 8, 2022, while its intermediate-term trend has been UP since February 2, 2023. On the other hand, its short-term trend has been DOWN since February 24, 2023.
The Trade Triangles are our proprietary indicators, comprised of weighted factors that include (but are not necessarily limited to) price change, percentage change, moving averages, and new highs/lows. The Trade Triangles point in the direction of short-term, intermediate, and long-term trends, looking for periods of alignment and, therefore, intense swings in price.
In terms of the Chart Analysis Score, another MarketClub proprietary tool, HSY, scored +75 on a scale from -100 (strong downtrend) to +100 (strong uptrend), indicating short-term weakness. However, it remains in the confines of a long-term uptrend.

The Chart Analysis Score measures trend strength and direction based on five different timing thresholds. This tool takes into account intraday price action, new daily, weekly, and monthly highs and lows, and moving averages.
Click here to see the latest Score and Signals for HSY.
Acuity Brands, Inc. (AYI)
AYI provides lighting and building management solutions worldwide. The company operates through two segments: Acuity Brands Lighting and Lighting Controls (ABL) and the Intelligent Spaces Group (ISG).
In terms of trailing-12-month EBIT margin, AYI’s 12.58% is 30.8% higher than the industry average of 9.62%. Likewise, its 14.87% trailing-12-month EBITDA margin is 12% higher than the industry average of 13.27%. Furthermore, the stock’s 1.16x trailing-12-month asset turnover ratio is 45% higher than the industry average of 0.80x.
In terms of forward non-GAAP P/E, AYI’s 14x is 20.2% lower than the 17.54x industry average. Its 9.91x forward EV/EBITDA is 10% lower than the 11.02x industry average. Likewise, its 10.78x forward EV/EBIT is 29.1% lower than the 15.21x industry average.
AYI’s net sales for the fiscal first quarter that ended November 30, 2022, increased 7.8% year-over-year to $997.90 billion. Its non-GAAP net income increased 6.1% year-over-year to $107.50 million. The company’s non-GAAP operating profit increased 5.3% year-over-year to $140.10 million.
Moreover, its adjusted EBITDA increased 4.1% year-over-year to $153 million, while its non-GAAP EPS came in at $3.29, representing a 15.4% increase from the prior-year quarter.
Analysts expect AYI’s EPS and revenue for the quarter ending February 28, 2023, to increase 6.1% and 5.5% year-over-year to $2.73 and $958.98 million, respectively. It has an impressive earnings surprise history, surpassing the consensus EPS estimates in each of the trailing four quarters. The stock has gained 16.5% year-to-date to close the last trading session at $192.94.
AYI’s stock is trading above its 50-day and 200-day moving averages of $179.85 and $174.05, respectively, indicating an uptrend.
Trade Triangles show that AYI has been trending UP for all three-time horizons. The long-term for AYI has been UP since August 16, 2022, while its intermediate-term trend has been up since January 9, 2023, respectively. Its short-term trend has been UP since February 27, 2023.
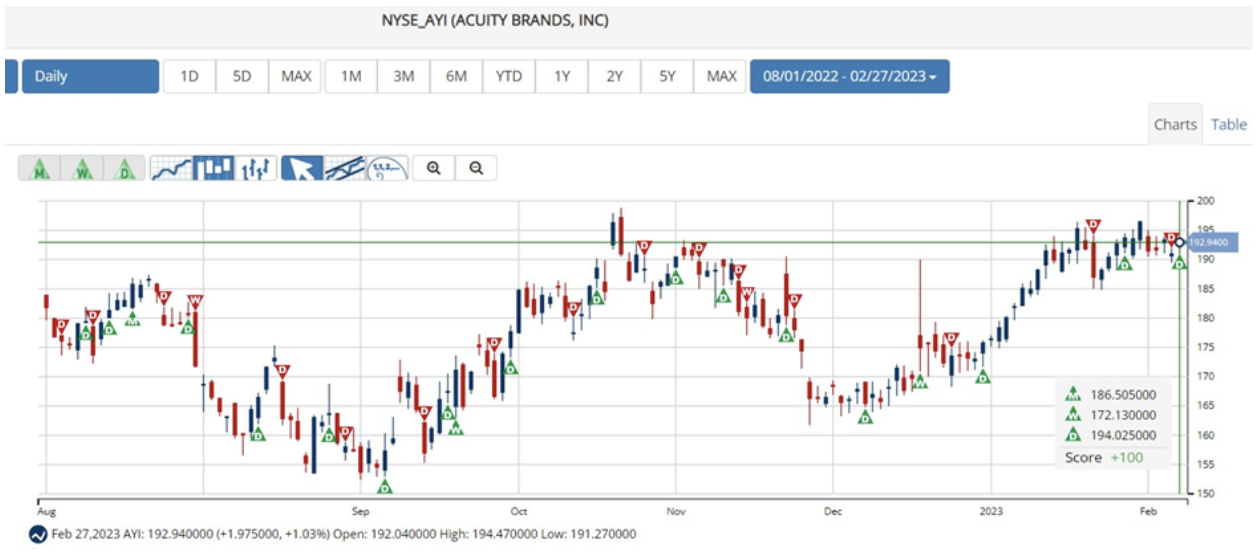
In terms of the Chart Analysis Score, AYI scored +100 on a scale from -100 (strong downtrend) to +100 (strong uptrend), indicating that the uptrend will likely continue.

Click here to see the latest Score and Signals for AYI.
Flowers Foods, Inc. (FLO)
FLO produces and markets packaged bakery products in the United States. It offers fresh bread, buns, rolls, snack cakes, tortillas, frozen bread, and rolls under the Nature’s Own, Dave’s Killer Bread, Wonder, Canyon Bakehouse, Mrs. Freshley’s, and Tastykake brand names.
On February 20, 2023, FLO announced that it had completed the acquisition of Papa Pita Bakery, a manufacturer and distributor of high-quality bagels, tortillas, breads, buns, English muffins, and flatbreads. Papa Pita Bakery will operate as an independent subsidiary of FLO.
FLO’s President and CEO Ryals McMullian said, “Papa Pita has been an important co-manufacturer of Flowers products for many years, and we expect the acquisition to drive further manufacturing and distribution synergies.”
In terms of the trailing-12-month gross profit margin, FLO’s 47.94% is 51.7% higher than the industry average of 31.61%. Likewise, its 3.67% trailing-12-month levered FCF margin is 45.3% higher than the industry average of 2.53%. Furthermore, the stock’s 1.46x trailing-12-month asset turnover ratio is 75.3% higher than the industry average of 0.84x.
In terms of forward EV/Sales, FLO’s 1.35x is 18.4% lower than the 1.66x industry average. Its 13.30x forward EV/EBITDA is 18.6% higher than the 11.21x industry average. Likewise, its 19.20x forward EV/EBIT is 25.3% higher than the 15.32x industry average.
FLO’s net sales increased 10.1% year-over-year to $1.08 billion for the fourth quarter ended December 31, 2022. Its net cash provided by operating activities rose 136% from the prior-year quarter to $69.36 million.
The company’s adjusted EBITDA increased 8.5% year-over-year to $96.18 million. Also, its adjusted net income increased 14.9% year-over-year to $48.12 million. In addition, its adjusted EPS came in at $0.23, representing an increase of 15% year-over-year.
Analysts expect FLO’s revenue for the quarter ending March 31, 2023, to increase 8% year-over-year to $1.55 billion. Its EPS for fiscal 2024 is expected to increase 9.1% year-over-year to $1.37. It surpassed the consensus EPS estimates in three of the trailing four quarters. Over the past month, the stock has gained 6.1% to close the last trading session at $28.33.
FLO’s stock is trading above its 50-day and 200-day moving averages of $28 and $27.32, respectively, indicating an uptrend.
Trade Triangles show that FLO has been trending UP for two of the three-time horizons. FLO’s long-term trend has been UP since October 28, 2022, while its intermediate-term trend has been UP since February 17, 2023. On the other hand, its short-term trend has been DOWN since February 27, 2023.
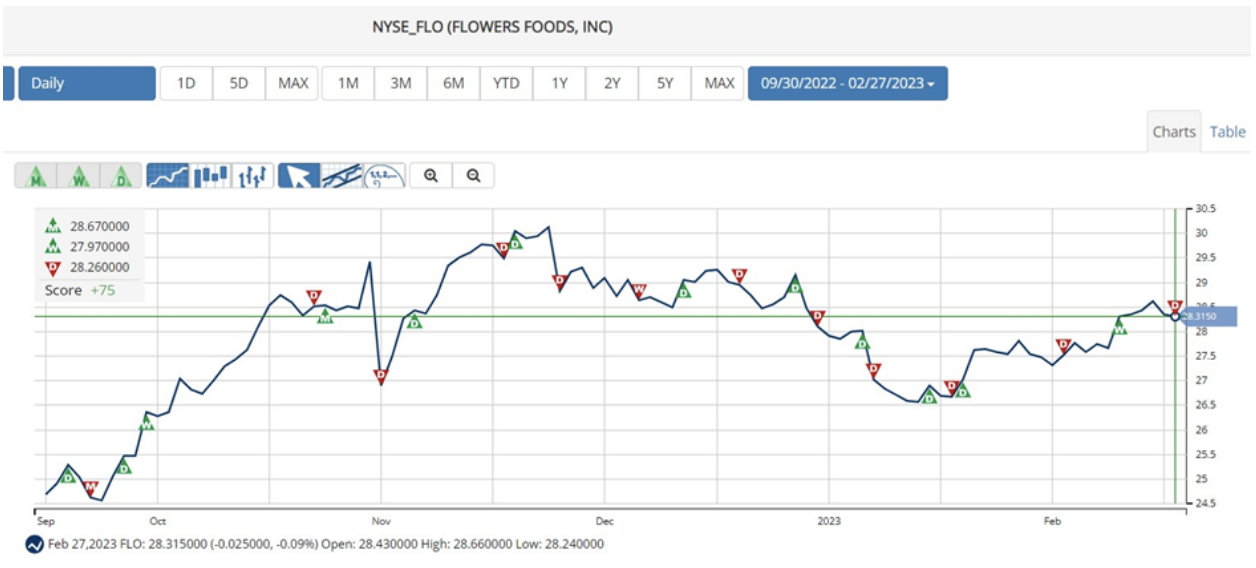
In terms of the Chart Analysis Score, FLO scored +75 on a scale from -100 (strong downtrend) to +100 (strong uptrend), indicating short-term weakness. However, it remains in the confines of a long-term uptrend.
Click here to see the latest Score and Signals for FLO.
What's Next for These Stocks?
Remember, the markets move fast and things may quickly change for these stocks. Our MarketClub members have access to entry and exit signals so they'll know when the trends starts to reverse.
Join MarketClub now to see the latest signals and scores, get alerts, and read member-exclusive analysis for over 350K stocks, futures, ETFs, forex pairs and mutual funds.
Best,
The MarketClub Team
su*****@in*.com