
Twilio Inc. (TWLO) enables developers to build, scale, and operate real-time communications within software applications through a cloud communication platform and a customer engagement platform. The company operates both in the United States and internationally.
Over the past three years, TWLO’s revenues have increased at a 50% CAGR. Its total assets increased at a 34.6% CAGR during the same time horizon.
TWLO has adopted sweeping changes to improve the efficiency of its execution and accelerate its path to profitability. On February 13, the company announced its decision to reduce its workforce by approximately 17% to drive meaningful cost savings. To rationalize expenses further, on December 9, 2022, it announced its voluntary delisting from the Long-Term Stock Exchange (LTSE) to remain solely listed on the NYSE.
TWLO has also announced that, moving forward, it will operate two separate business units: Twilio Communications and Twilio Data & Applications. This strategic realignment enables Twilio to execute each business's key priorities better.
TWLO’s management has expressed its confidence regarding the effectiveness of the abovementioned changes by announcing the authorization of a share repurchase program of up to $1.0 billion of its outstanding Class A common stock.
TWLO’s stock has gained 17.1% over the past month to close the last trading session at $73.88.
TWLO is trading above its 50-day and 200-day moving averages of $57.86 and $70.99, respectively, indicating an uptrend.
Here is what may help the stock maintain its performance in the near term.
Improving Financials
During the fourth quarter of the fiscal that ended December 31, 2022, TWLO’s revenue increased 21.6% year-over-year to $1.03 billion, while its non-GAAP gross profit increased 19.9% year-over-year to $517.78 million.
During the same period, the company’s non-GAAP operating income and non-GAAP net income attributable to common shareholders came in at $32.87 million and $41.05 million, compared to losses of $27.19 million and $36.26 million, respectively, in the prior-year quarter.
As a result, TWLO’s non-GAAP net income attributable to common shareholders came in at $0.22, compared to a loss of $0.20 per share in the previous-year quarter.
Favorable Analyst Estimates
For the first quarter of fiscal 2023, TWLO is expected to report a total revenue of $1 billion, up 14.2% year-over-year. During the same period, the company’s EPS is expected to come in at $0.21, compared to its muted performance during the previous-year quarter.
TWLO has impressed by surpassing consensus EPS estimates in each of its trailing four quarters.
For fiscal 2023, TWLO’s revenue is expected to increase 12.7% year-over-year to $4.31 billion, while its EPS is expected to come in at $1.25, compared to a loss per share of $0.15 during fiscal 2022.
Both revenue and EPS are expected to keep growing over the next two fiscal years.
Justified Valuation
Given the optimistic analyst expectations, TWLO is trading at a forward P/E of 58.89, a premium of 187.7% above the industry average of 20.47. Similarly, its forward EV/EBITDA and Price/Sales multiples of 19.32 and 3.21 are 46.3% and 15.2% above the respective industry averages of 13.21 and 2.79.
However, despite upward momentum in price and business performance, TWLO’s forward EV/Sales and Price/Book multiples of 2.53 and 1.39 also compare favorably to the respective industry averages of 2.84 and 3.81.
Technical Indicators Look Promising
MarketClub’s Trade Triangles show that TWLO has been trending UP for each of the three time horizons. The long-term trend has been UP since February 16, 2023, while the intermediate-term and short-term trends have been UP since January 13, 2023, and February 28, 2023, respectively.
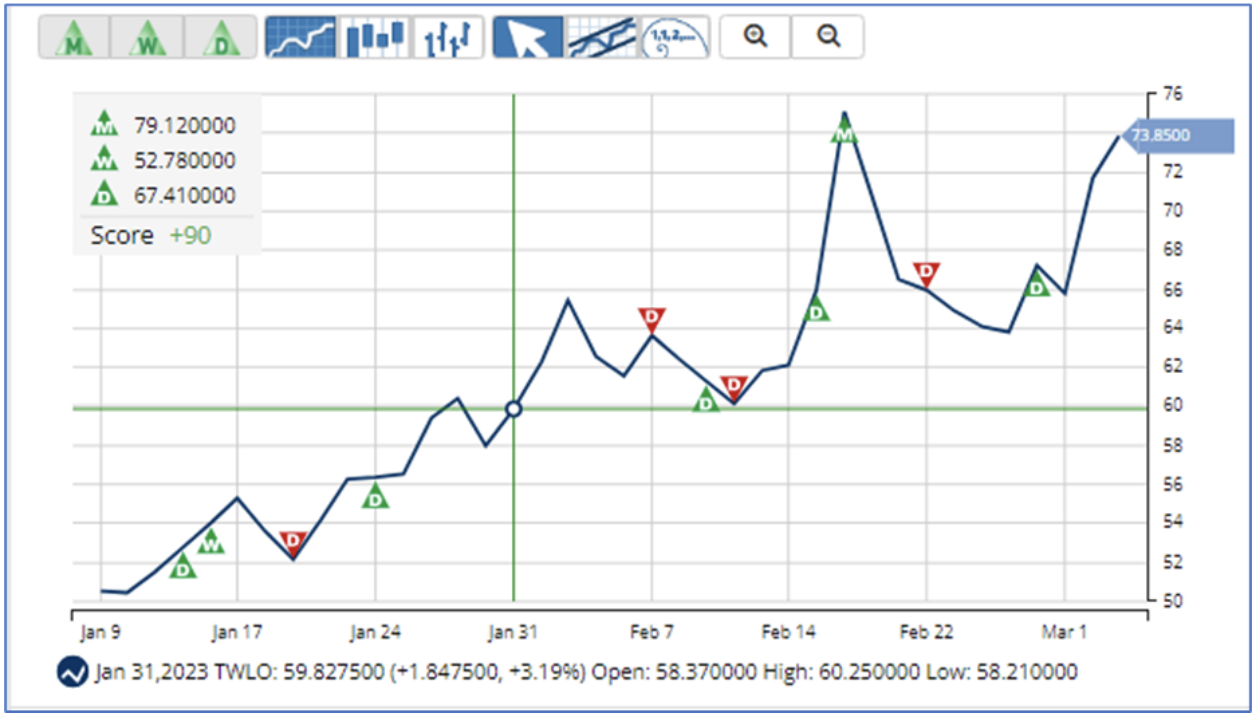
The Trade Triangles are our proprietary indicators, comprised of weighted factors that include (but are not necessarily limited to) price change, percentage change, moving averages, and new highs/lows. The Trade Triangles point in the direction of short-term, intermediate, and long-term trends, looking for periods of alignment and, therefore, strong swings in price.
In terms of the Chart Analysis Score, another MarketClub proprietary tool, TWLO scored +90 on a scale from -100 (strong downtrend) to +100 (strong uptrend), indicating that the uptrend will likely continue. Although TWLO remains in the confines of a bullish trend, traders should use caution and utilize a stop order.
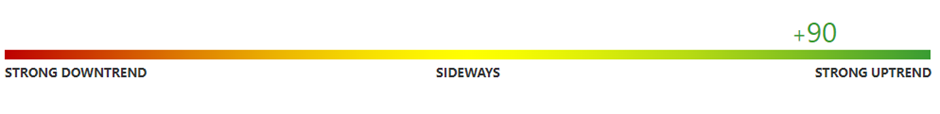
The Chart Analysis Score measures trend strength and direction based on five different timing thresholds. This tool takes into account intraday price action, new daily, weekly, and monthly highs and lows, and moving averages.
Click here to see the latest Score and Signals for TWLO.
What's Next for This Stock?
Remember, the markets move fast and things may quickly change for this stocks. Our MarketClub members have access to entry and exit signals so they'll know when the trends starts to reverse.
Join MarketClub now to see the latest signals and scores, get alerts, and read member-exclusive analysis for over 350K stocks, futures, ETFs, forex pairs and mutual funds.
Best,
The MarketClub Team
su*****@in*.com