
I would like to share my recent finding in the Emerging Markets ETF chart, as it could be a wake-up call for investors from the distant 2007.
Usually, emerging markets provide a higher return amid a higher risk profile. When investors cut the risk, they often start with emerging markets to quit until the liquidity is available.
The chart below represents the dynamics of iShares MSCI Emerging Markets ETF (EEM). It tracks the MSCI Emerging Markets Index covering 25 countries shown in the following graph.
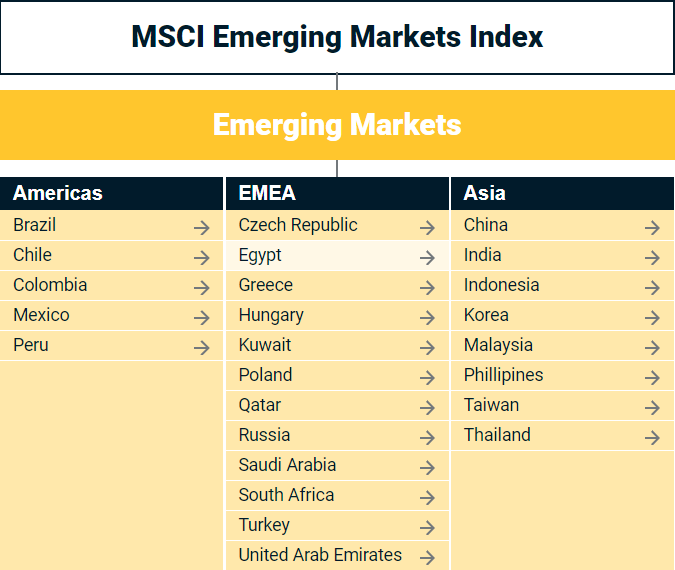

China is dominating in country weights, followed by Taiwan and South Korea.
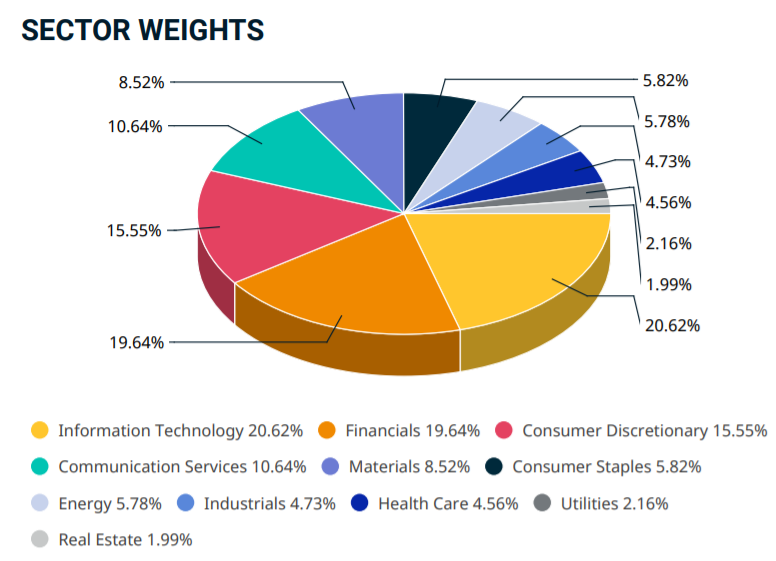
The information technology sector tops the list; the financial sector has the second-largest weight.
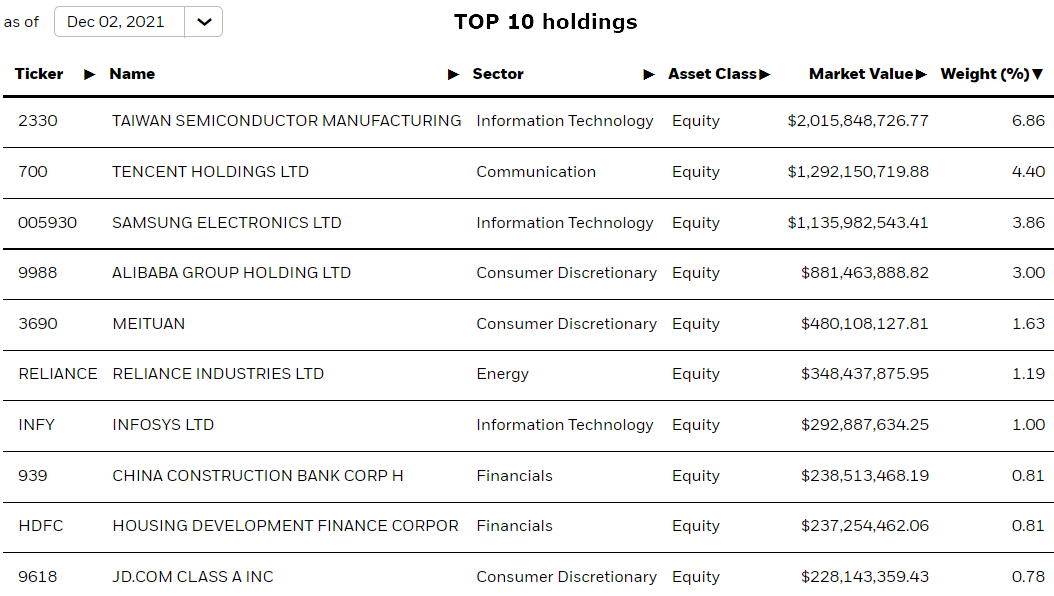
The well-known chipmaker Taiwan Semiconductor Manufacturing Co Ltd has the largest share of 6.86% in the ETF. Chinese behemoth Tencent Holdings Ltd (4.40%) and Korean giant Samsung Electronics Ltd (3.86%) make the top two and three respectively. The "Amazon of China" Alibaba Group Holding Ltd has left the top three after it felt the heat from the Chinese government.
After familiarizing myself with the ETFs background, we can now get down to the price chart.
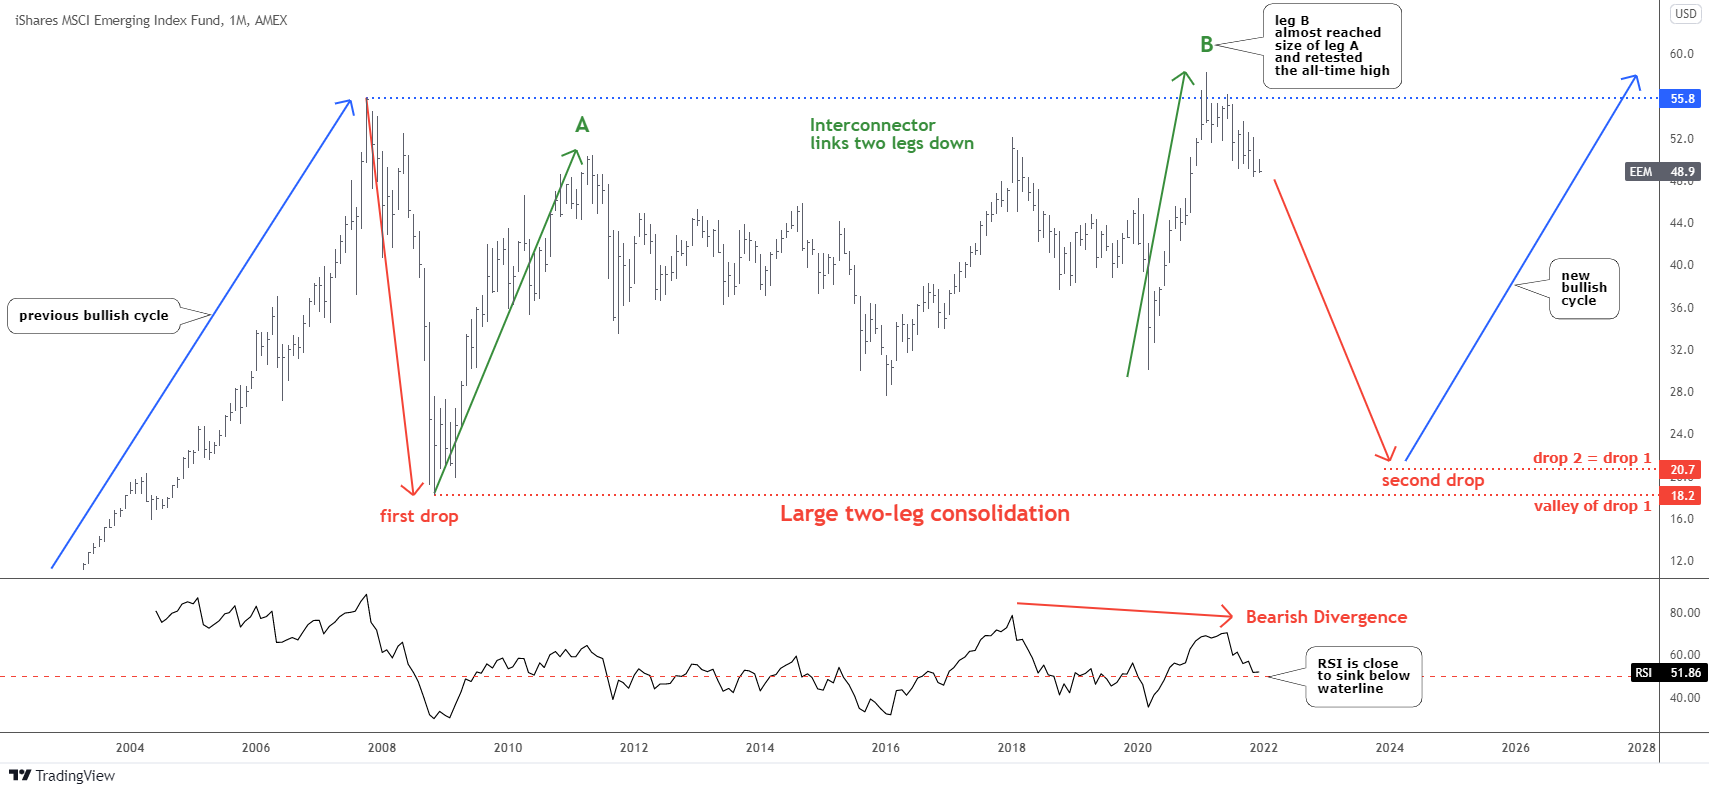
The EEM price went almost through a full cycle of boom and bust during the eighteen years covered in the chart above. The left blue up arrow highlights the previous bullish cycle between 2003 and 2007.
The next red down arrow represents the outbreak of a Great Recession that looks so distant now. I labeled it as a "first drop." It hit the valley of $18.2 in November of 2008; the ETF had lost 67% from the peak of 2007 ($55.8) then. That collapse was very sharp, pushed by a panic selling.
The following green "interconnector" phase took much more time to emerge than the previous blue and red stages. This was due to a long counter-trend consolidation between sharp green legs A and B. This February, the green leg B almost reached the size of green leg A to the upside as it managed to retest the all-time high of $55.8 set during the previous bullish cycle. The new record high was established at $58.3. This is enough to consider the green phase to be completed.
The RSI indicator has shown a Bearish Divergence, as it did not confirm the new all-time high in the price chart as it had a lower top instead. It played out already as the price turned South since then. The indicator is falling, and it is close to sinking below the "waterline" to trigger the bear market.
The second drop looks imminent as the price this month has a small uptick in the current bar, and it is close to a multi-month valley of $48.4 established in the previous month of November. There are two possible targets; the nearest one is located at $20.7 at an equal distance with the first drop as we have a higher starting point.
The second target is set in the valley of the first drop at $18.2. It is a classic approach as it implies shaping an ideal box between the top and the bottom of the range. Unfortunately, both targets are painful, as the price should lose 58% and 63% respectively from the last Friday's close.
The invalidation for this scenario is quite far as it is set above the all-time high of $58.3.
Earlier this September, I already have shown you an accumulated misbalance in the U.S. stock market as the value stocks stagnated for seven months in a row already. The majority of readers bet on 10-20% collapse of S&P 500 then.
Last week the Bank of America called for a market top as "Just five of the biggest U.S. technology stocks accounted for 71% of the nearly 20% gains in U.S. stocks". A situation in which a tiny group of stocks powers gains while others lose ground is often viewed as an indicator that a rally is running out of steam.
"Hikes plus volatility plus divergences often a market top make," strategists at U.S. investment bank BofA led by Michael Hartnett said in a note quoted by Reuters.
Please kindly share your opinion with all of us on the Blog.
Intelligent trades!
Aibek Burabayev
INO.com Contributor, Metals
Disclosure: This contributor has no positions in any stocks mentioned in this article. This article is the opinion of the contributor themselves. The above is a matter of opinion provided for general information purposes only and is not intended as investment advice. This contributor is not receiving compensation (other than from INO.com) for their opinion.
Emerging markets still pose some invisible risks, but at the same time have the best chance of outperforming the developed markets over the long term. Some pockets of them are also over valued.
Dear Rajeev, thank you for sharing your opinion.
The chart confirms your words as since inception in 2003, EEM gained almost 400% to the top in 2007.
The turning point was last spring when all markets dropped but the SPY could bounce back up and even beat the EEM this year as the latter reversed to the South. This is how structure plays out.
Stay tuned, thank you for reading, Aibek
I don't see the companies that you are taking about
Dear Mr.Anthony,
I guess you are talking about top 10 holdings.
These are the local listings of the mentioned companies in their home countries.
Some of them are also listed on U.S. exchanges as well like Taiwan Semiconductor, Alibaba, Infosys, JD.com.
Best wishes, Aibek