
The Japanese yen is the second largest component of the Dollar Index (DX). It occupies 13.6% of it.
The real interest rate differential is the main reason behind the current severe weakness of the yen. I have already visualized it for you in my earlier post in August.
The Bank of England (GBP, 3rd largest part of DX) and lately the European Central Bank (EUR, the largest component of DX) raised their interest rates significantly during the last meetings. The Bank of Japan (BOJ), the Japanese Central Bank has kept its negative rate of -0.1% since 2016. Moreover, it repeated that it would not hesitate to take extra easing measures if needed, falling out of a global wave of central banks tightening policy.
Why BOJ is so dovish? There are several reasons. One of them, the history of inflation as shown in the chart below.
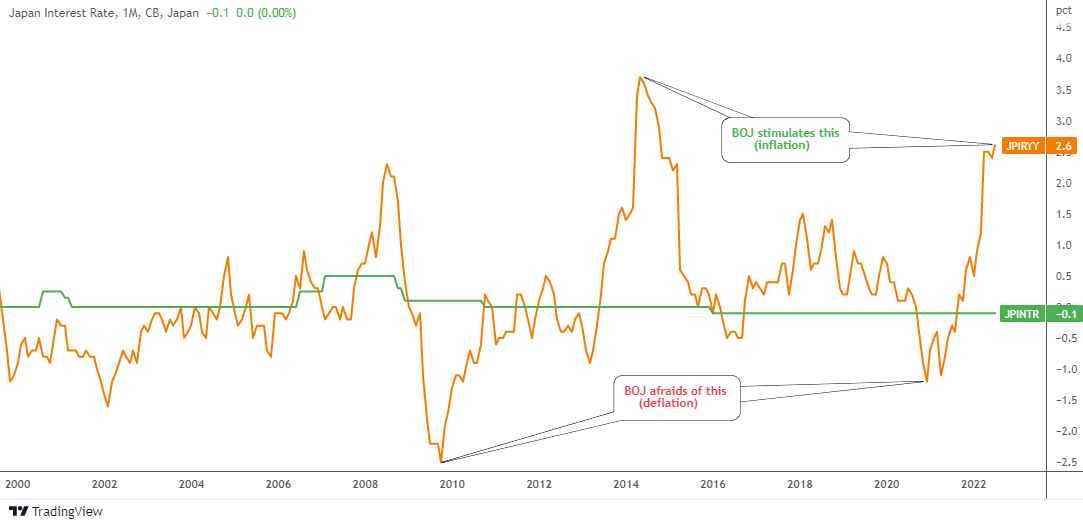
Japan has had a chronic deflation since the 1990s after the asset bubble burst. We can see how short term spikes of inflation (orange line) into the positive territory were short-lived. The BOJ didn’t even touch the interest rate in spite of inflation that has soared to unseen levels of 3.7% in 2014. This time around, the inflation didn’t race to the same peak and as I wrote above, the BOJ thinks of an opposite – easing!
The BOJ governor Mr. Kuroda said in the summer “If we raise interest rates, the economy will move into a negative direction.” The Japanese Central Bank does not want to cause a recession as the economy is still fragile.
Maybe the next chart could clarify the logic of the BOJ.
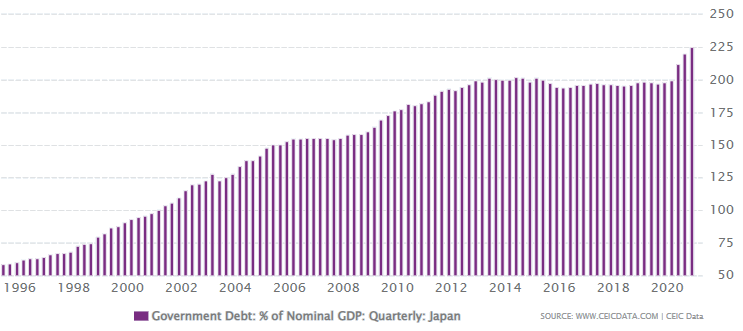
The land of the rising sun has hoarded the giant government debt from circa 56% of nominal GDP in 1994 up to the current 231%. This indicator in the U.S. stands close to 140%. From this perspective, rising interest rates means growing expenses to serve the debt. This could demotivate the tightening.
Now, let us move to the comparison of the FX chart with the real interest rate differential.
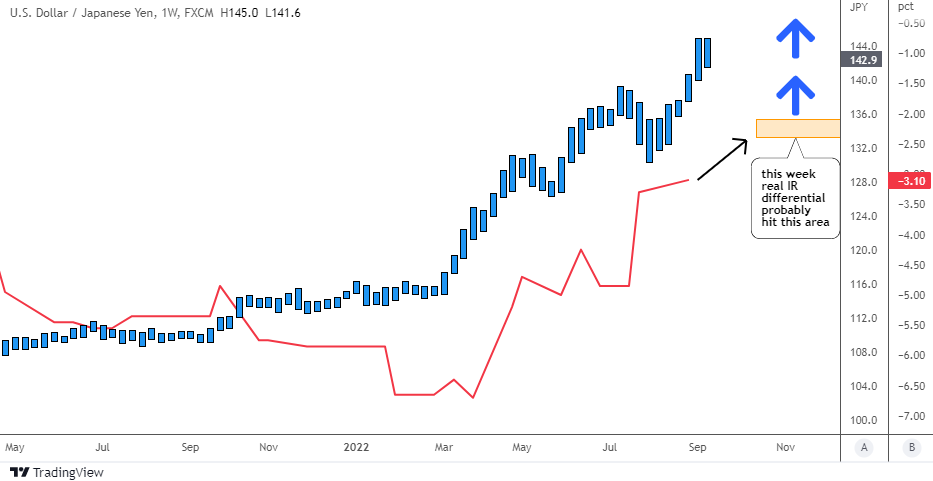
The USDJPY (blue bars) accelerated higher with the rising real interest rate differential (red line) this year.
The Fed is not afraid to throw the U.S. economy into a recession, but the BOJ is, so the former makes unprecedented hikes of the interest rate. The next Fed move is expected this week and the only question is +0.75% or +1%.
I added an orange box on the chart to highlight the area where the negative gap will shrink from the current -3.1%. It could hit either -2.45% or -2.10%. This could charge another rally of the US dollar against the Japanese yen towards ¥150 per $1 and beyond.
I would like to complete the picture with the technical chart below.
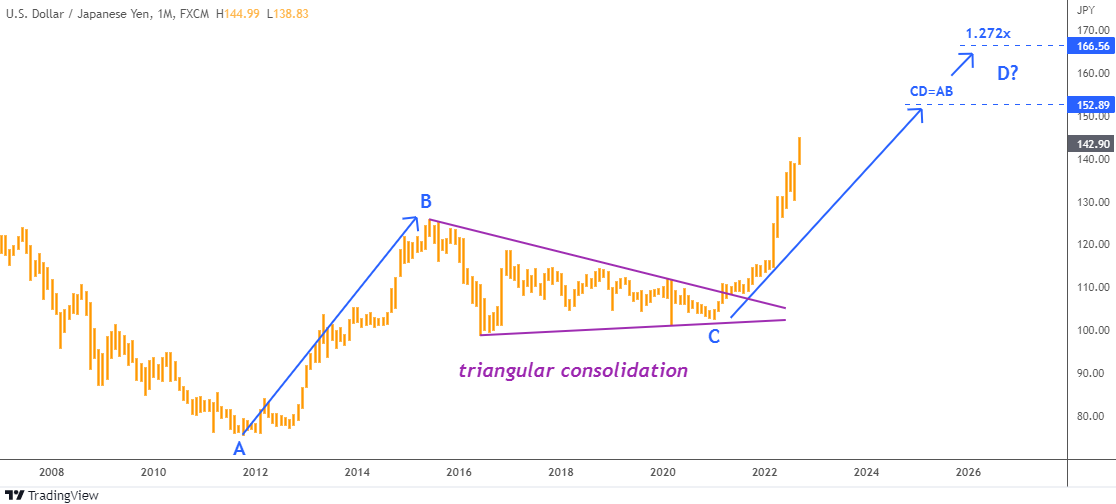
The yen chart is just beautiful. The USDJPY is usually one of the clearest in terms of the structure among foreign exchange pairs.
Since 2011, we can highlight two large moves to the upside. The first move, marked as a blue AB segment, was completed in 2015. The following BC consolidation has emerged in the form of a Triangular Consolidation (purple trendlines). It took the market almost six years to shape this large structure, longer than the preceding AB move. This again confirms the tricky nature of corrections and its time consuming ability.
We are on the CD move now. It has a sharp angle, though it could last longer. This part will travel the same distance as the first move when it will reach ¥152.89. The yen should weaken 7% in this case. The next target is located at the 1.272x of AB segment at ¥166.56, which equals to 16.6% of dollar gain.
The nearest support is located in the valley of the preceding correction in ¥130. The 52-week simple moving average is located lower at ¥123.48. Both supports are too far, as the trend is sharp.
Intelligent trades!
Aibek Burabayev
INO.com Contributor
Disclosure: This contributor has no positions in any stocks mentioned in this article. This article is the opinion of the contributor themselves. The above is a matter of opinion provided for general information purposes only and is not intended as investment advice. This contributor is not receiving compensation (other than from INO.com) for their opinion.