
While the U.S. economy grew at a 2.6% annual rate in the third quarter, high inflation, weak third-quarter corporate earnings, and fears of another aggressive rate hike by the Fed are raising the possibility of a recession in the next 12 months.
With investors anticipating a broad slowdown, this year could be the worst year for the stock market since the 2008 financial crisis.
However, a corresponding slowdown in the energy demand can be safely ruled out due to supply-side constraints caused by the conflict between Russia and Ukraine and OPEC+’s decision to cut oil production by 2 million barrels/day.
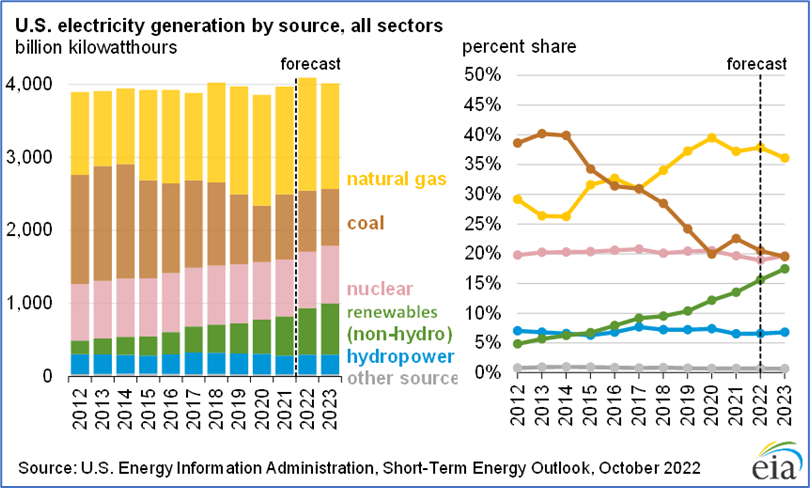
According to the short-term energy outlook released by the U.S Energy Information Administration, the U.S. residential price of electricity will average 14.9 cents per kilowatt hour in 2022, up 8% from 2021. Higher retail electricity prices largely reflect an increase in wholesale power prices, driven by higher natural gas prices.
Besides, energy demand is expected to grow in the long run due to increased economic activity and the effects of climate change. The global energy as a service market is projected to grow at a 7.6% CAGR to reach $112.7 billion by 2030.
Hence, it would be opportune to load up on energy stocks ConocoPhillips (COP), Murphy Oil Corporation (MUR), and Tidewater Inc. (TDW) as some technical indicators point to their upside.
ConocoPhillips (COP)
COP is an independent exploration and production company with a market capitalization of $159.31 billion. The company operates through six segments: Alaska; Lower 48; Canada; Europe, Middle East and North Africa; Asia Pacific; and Other International.
Over the last three years, COP has grown its revenue at a 21.6% CAGR, while its EBITDA has grown at 24.5% CAGR.
During the second quarter of the fiscal year 2022, COP’s total revenue and other income increased 115.3% year-over-year to $21.99 billion. During the same period, the company’s total average realized price increased by 77% year-over-year to $88.57 per barrel of oil equivalent (BOE).
Due to higher realized prices and unhedged production, adjusted earnings for the quarter came in at $5.1 billion, or $3.91 per share, up 200% and 207.9%, respectively.
The consensus revenue estimate of $77.01 billion for the fiscal year 2022 represents a 59.3% improvement year-over-year. Street also expects COP’s EPS to grow 134.4% year-over-year to $14.09 during the same period. Additionally, the company has surpassed consensus EPS estimates in each of the trailing four quarters.
COP is currently trading at a premium, indicating high expectations regarding the company’s performance in the upcoming quarters. In terms of forward P/E, COP is presently trading at 8.98x, 9.4% higher than the industry average of 8.21x. Also, it is trading at a forward Price/Sales multiple of 2.09, compared to the industry average of 1.42.
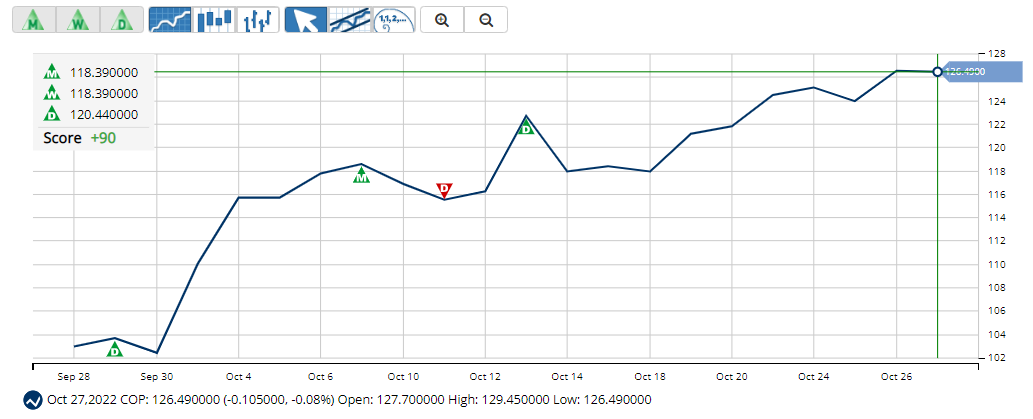
The stock is currently trading above its 50-day and 200-day moving averages of $112.40 and $100.77, respectively, indicating an uptrend. It has gained 25.3% over the past month to close the last trading session at $126.57.
MarketClub’s Trade Triangles show that COP has been trending UP for all three time horizons. The long-term and intermediate-term trends for COP have been UP since October 7, 2022, while its short-term trends have been UP since October 13, 2022.
The Trade Triangles are our proprietary indicators, comprised of weighted factors that include (but are not necessarily limited to) price change, percentage change, moving averages, and new highs/lows. The Trade Triangles point in the direction of short-term, intermediate, and long-term trends, looking for periods of alignment and, therefore, strong swings in price.
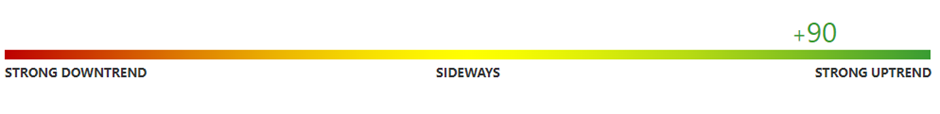
In terms of the Chart Analysis Score, another MarketClub proprietary tool, COP scored +90 on a scale from -100 (strong downtrend) to +100 (strong uptrend), indicating that the uptrend is likely to continue. While COP is showing intraday weakness, it remains in the confines of a bullish trend. Traders should use caution and utilize a stop order.
The Chart Analysis Score measures trend strength and direction based on five different timing thresholds. This tool considers intraday price action, new daily, weekly, and monthly highs and lows, and moving averages.
Click here to see the latest Score and Signals for COP.
Murphy Oil Corporation (MUR)
With a market capitalization of $7.47 billion, MUR is involved in the exploration for and production of oil and natural gas globally. The company operates through onshore and offshore operations and properties in three geographic segments: the United States, Canada, and all other countries.
MUR has grown its revenue, EBITDA, and EPS at 15.4%, 11.4%, and 20% CAGRs over the last three years.
In the fiscal 2022 second quarter that ended June 30, 2022, MUR’s total revenues and other income increased 100.3% year-over-year to $1.10 billion. The improved performance was driven by better-than-expected well performance in the Gulf of Mexico and Eagle Ford Shale and lower than projected downtime across multiple assets. Most meaningfully, production from the new Khaleesi, Mormont, and Samurai wells exceeded expectations.
As a result of the above developments, the adjusted EBITDA attributable to MUR increased 61.6% year-over-year to $632.0 million, while the adjusted income from continuing operations attributable to MUR increased 234.4% year-over-year to $304.6 million, or $1.93 per share.
Analysts expect MUR’s revenue for the current fiscal year (ending December 31, 2022), to come in at $3.76 billion, indicating an increase of 63.5% year-over-year. The company’s EPS is expected to increase 355.7% year-over-year to $5.88. Furthermore, MUR has topped the consensus EPS estimates in three of the trailing four quarters.
Due to its bright prospects, MUR’s stock currently commands a slight premium valuation. Regarding forward P/E, MUR is currently trading at 8.21x, at par with the industry average. Also, its forward Price/Sales multiple of 2 is slightly higher than the industry average of 1.42.
MUR’s stock is currently trading above its 50-day and 200-day moving averages of $39.95 and $36.70, respectively, indicating a bullish trend. It has gained 46.6% over the past month to close the last trading session at $48.26.
MarketClub’s Trade Triangles show that MUR has been trending UP for all three time horizons. The long-term and intermediate-term trends for MUR have been UP since October 5, 2022, while its short-term trend has been UP since October 13, 2022.
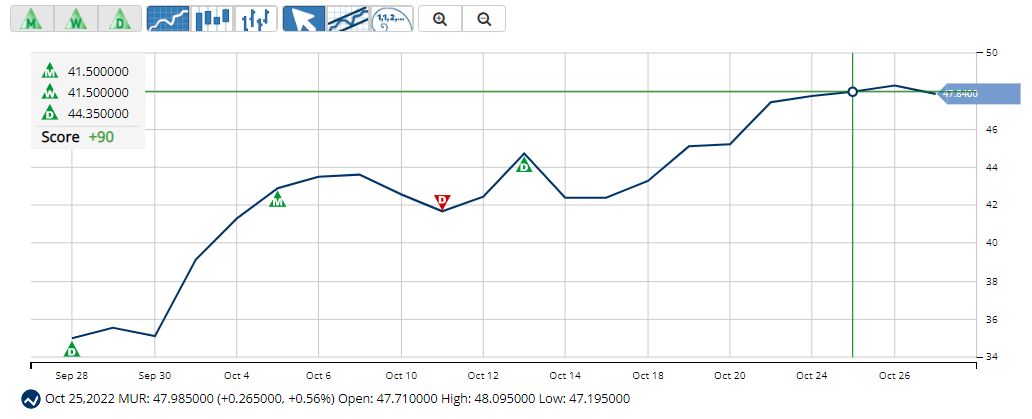
In terms of the Chart Analysis Score, another MarketClub proprietary tool, MUR scored +90 on a scale from -100 (strong downtrend) to +100 (strong uptrend), indicating that the uptrend will likely continue. While MUR is showing intraday weakness, it remains in the confines of a bullish trend. Traders should use caution and utilize a stop order.
Click here to see the latest Score and Signals for MUR.
Tidewater Inc. (TDW)
With a market capitalization of $1.43 billion, TDW is the provider of offshore marine and transportation services to the global offshore energy industry. The company operates a diversified fleet of marine service vessels to cater to its geographic segments: the Americas; the Middle East/Asia Pacific; the Europe/Mediterranean; and West Africa.
During the fiscal second quarter ended June 30, 2022, TDW’s total revenue came in at $163.45 million, registering an increase of 81.7% year-over-year, thereby reflecting the impact of the Swire Pacific Offshore (SPO) acquisition. During the same period the company reported an operating income of $1.84 million, compared to an operating loss of $20.16 million during the previous-year quarter.
TDW has also taken advantage of the tight supply environment to drive day rates for vessels in a strong demand environment and narrow its net loss by 15.6% year-over-year to $25.01 million.
Analysts expect TDW’s revenue for the current fiscal year (ending December 2022), to increase 67.4% year-over-year to $621.10 million, while its loss per share is expected to narrow 60.1% to $0.97. The company’s impressive earnings surprise history has seen it surpass consensus EPS estimates in three of the trailing four quarters.
Due to its positive outlook, the stock is trading at a premium compared to its peers. In terms of forward Price/Sales, TDW is trading at 2.42x, 70.4% higher than the industry average of 1.42x. Also, it is currently trading at a forward EV/EBITDA of 10.91x, compared to the industry average of 5.84x.
TDW’s stock is trading above its 50-day and 200-day moving averages of $23.82 and $20.85, respectively, indicating an uptrend. It has gained 53.3% over the past month to close the last trading session at $32.52.
MarketClub’s Trade Triangles show TDW has been trending UP for all three time horizons. The long-term trend for TDW has been UP since October 18, 2022, while its intermediate-term and short-term trends have been UP since October 17 and October 14, 2022, respectively.
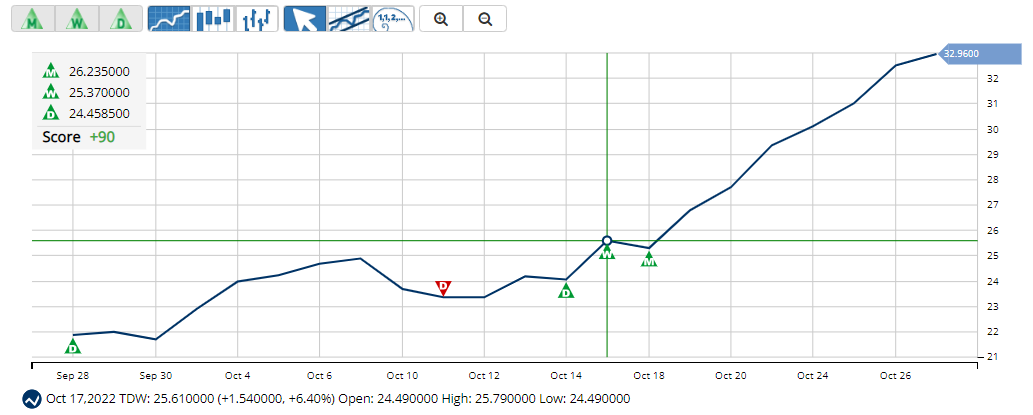
In terms of the Chart Analysis Score, another MarketClub proprietary tool, TDW scored +90 on a scale from -100 (strong downtrend) to +100 (strong uptrend), indicating that the uptrend is likely to continue. While TDW is showing intraday weakness, it remains in the confines of a bullish trend. Traders should use caution and utilize a stop order.
Click here to see the latest Score and Signals for TDW.
What's Next for These Energy Stocks?
Remember, the markets move fast and things may quickly change for these stocks. Our MarketClub members have access to entry and exit signals so they'll know when the trend starts to reverse.
Join MarketClub now to see the latest signals and scores, get alerts, and read member-exclusive analysis for over 350K stocks, futures, ETFs, forex pairs and mutual funds.
Best,
The MarketClub Team
su*****@in*.com