
Solar tracking systems and related products manufacturer and supplier Array Technologies, Inc. (ARRY) surpassed the consensus revenue and EPS estimates for the third quarter of fiscal 2022 by 29.8% and 77.4%, respectively.
The company reported revenue of $515 million, compared to $188.70 million in the prior-year period. The revenue growth was driven by the acquisition of STI Norland and strong organic growth within its legacy Array business.
The company’s net income came in at $28 million compared to an adjusted net loss of $11.80 million in the year-ago quarter. Net income per share came in at $0.18 versus an adjusted net loss per share of $0.09 a year ago.
Additionally, ARRY produced $102 million of free cash flow during the quarter, allowing the company to pay down its revolving credit facility fully. At quarter-end, the company had access to $166.6 million of the revolving facility and $62.8 million of cash for total liquidity of $229 million, excluding the additional preferred share availability of $100 million.
“Overall, our performance in the third quarter demonstrates not only the strength of customer demand for our product and service offerings but also the continued effects of our focused efforts to improve our operational execution in all aspects of the business,” said ARRY’s CEO, Kevin Hostetler.
On August 16, 2022, the Inflation Reduction Act was passed by Congress and signed into law by President Joe Biden. It represents a significant investment by the federal government in renewable energy and related technologies. It includes tax incentives that will spur domestic solar manufacturing.
The IRA is expected to allow the U.S. solar market to grow 40% through 2027, equal to 62 gigawatts (GW) of additional solar capacity, according to forecasts in the U.S. Solar Market Insight Q3 2022 report released by the Solar Energy Industries Association (SEIA) and Wood Mackenzie, a Verisk business.
“This report provides an early look at how the Inflation Reduction Act will transform America’s energy economy, and the forecasts show a wave of clean energy and manufacturing investments that will uplift communities nationwide,” said SEIA President and CEO Abigail Ross Hopper.
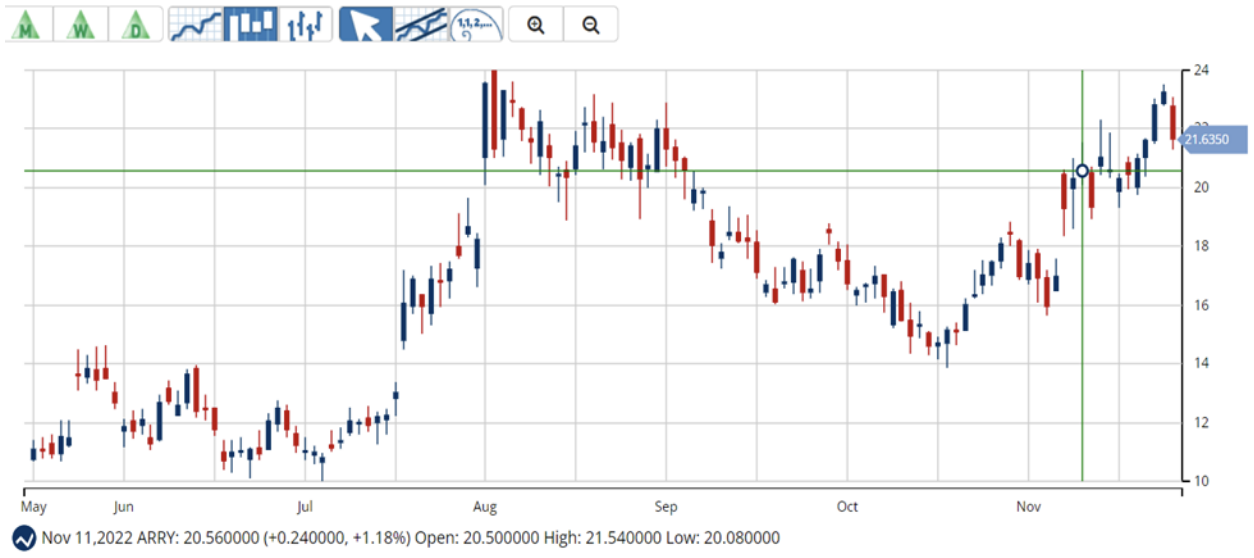
Shares of ARRY have gained 23.6% over the past month and 94.9% over the past six months to close the last trading session at $21.61. The stock is currently trading above its 50-day and 200-day moving averages of $17.74 and $13.97, respectively.
Here is what could influence ARRY’s performance in the upcoming months:
Positive Recent Developments
On November 7, ARRY was awarded a contract to supply its DuraTrack® solar trackers for EDF Renewables North America, one of North America's largest renewable energy developers. The company will supply its DuraTrack® solar trackers to an over 750 megawatt (MWdc) Ohio project on nearly 4,500 acres of land.
ARRY’s CEO, Kevin Hostetler, said, “By winning this project, Array is further solidifying its position as a leader in the utility-scale solar industry and demonstrating our ability to deliver quality products on time for our customers consistently.”
In September, ARRY launched its two newest product offerings, Array OmniTrack™ and Array STI H250. Launching these product families expands the company’s existing line of DuraTrack® products. ARRY’s broad portfolio of innovative product offerings continues to meet the growing demand for utility-scale solar energy installations.
Robust Financials
For the fiscal 2022 third quarter ended September 30, 2022, ARRY’s revenues increased 173% year-over-year to $515.02 million, while its gross profit grew 1,269.4% from the year-ago value to $80.22 million. The company’s income from operations came in at $18.52 million, compared to a loss from operations of $19.52 in the prior-year period.
Furthermore, the company’s adjusted EBITDA stood at $55.42 million, up 1,526.1% year-over-year. Its net income was $28 million compared to an adjusted net loss of $11.80 million during the same period in the previous year, while its net income per share was $0.18 versus an adjusted net loss per share of $0.09 during the last year’s quarter.
Favorable Analyst Estimates
Analysts expect ARRY’s revenue for the fiscal 2022 fourth quarter (ending December 2022) to come in at $345.21 million, indicating an increase of 57% from the prior-year period. The consensus EPS estimate of $0.11 for the ongoing quarter indicates a 283.3% year-over-year increase.
Moreover, the company has an impressive earnings surprise history since it surpassed the consensus EPS estimates in three of the trailing four quarters.
In addition, analysts expect ARRY’s revenue and EPS for the current fiscal year to increase by 85.5% and 414.3% from the previous year to $1.58 billion and $0.36, respectively. Also, the company’s revenue and EPS for the next year are expected to rise 21.7% and 177.8% year-over-year to $1.93 billion and $1, respectively.
Technical Indicators Show Promise
In addition to looking attractive from the fundamental point of view, ARRY shows strong trends, which makes it a solid stock to buy now.
According to MarketClub’s Trade Triangles, ARRY has been trending UP for all the three-time horizons. The long-term trend for ARRY has been UP since June 6, 2022, its intermediate-term trend has been UP since October 31, 2022, and its short-term trend has been UP since November 9, 2022.
The Trade Triangles are our proprietary indicators, comprised of weighted factors that include (but are not necessarily limited to) price change, percentage change, moving averages, and new highs/lows. The Trade Triangles point in the direction of short-term, intermediate, and long-term trends, looking for periods of alignment and, therefore, intense swings in price.
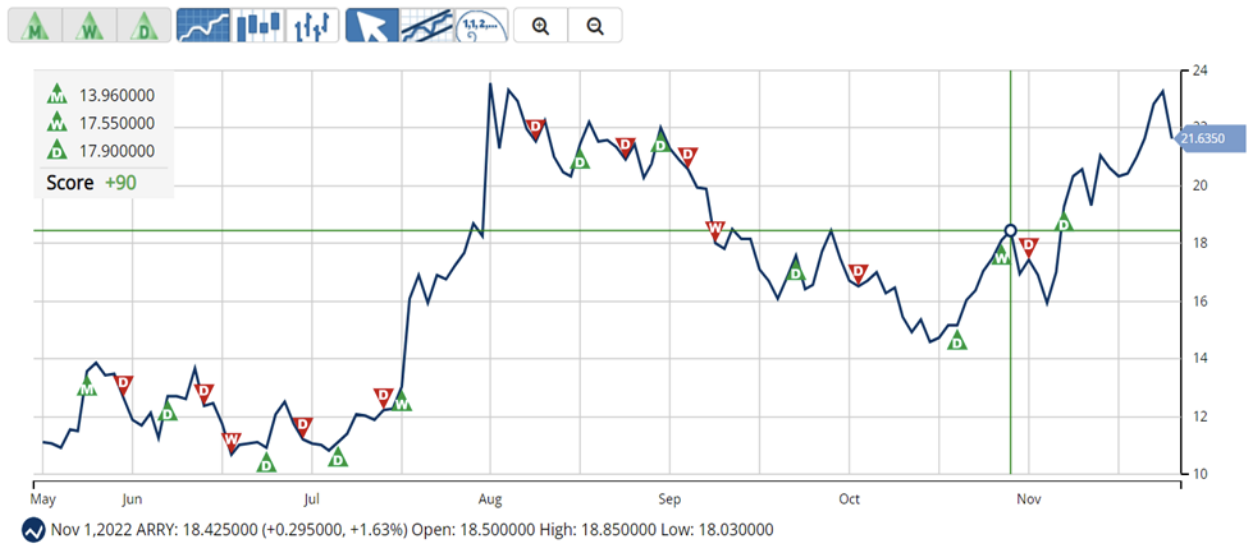
In terms of the Chart Analysis Score, another MarketClub proprietary tool, ARRY, scored +90 on a scale from -100 (strong downtrend) to +100 (strong uptrend), indicating that the uptrend is likely to continue. While ARRY shows intraday weakness, it remains in the confines of a bullish trend. Traders should use caution and utilize a stop order.

The Chart Analysis Score measures trend strength and direction based on five different timing thresholds. This tool considers intraday price action; new daily, weekly, and monthly highs and lows; and moving averages.
Click here to see the latest Score and Signals for ARRY.
What's Next for Array Technologies, Inc. (ARRY)?
Remember, the markets move fast and things may quickly change for this stock. Our MarketClub members have access to entry and exit signals so they'll know when the trend starts to reverse.
Join MarketClub now to see the latest signals and scores, get alerts, and read member-exclusive analysis for over 350K stocks, futures, ETFs, forex pairs and mutual funds.
Best,
The MarketClub Team
su*****@in*.com