
Please take a look at the graph below. These futures left their competitors far behind with a tremendous gain of almost twenty percent in only one month.
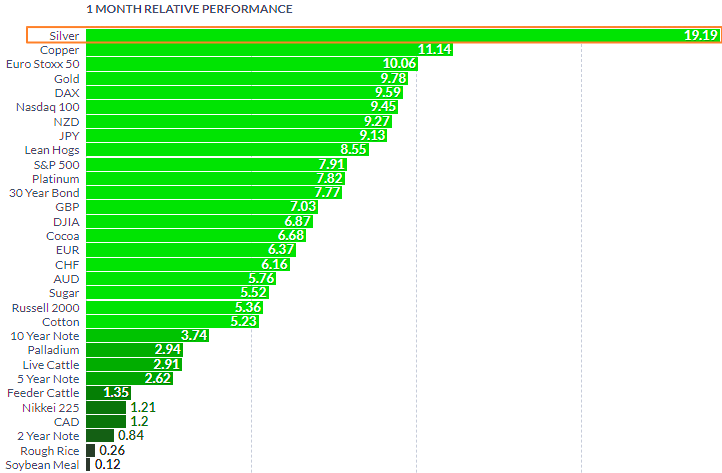
On a one-month horizon, silver's meteoric price increase is undeniable. None of the metals can even come close. Copper is lagging eight percent behind as gold futures show only half the performance of silver. By the way, I am about to show you the relative dynamics of these top metals in the chart below.
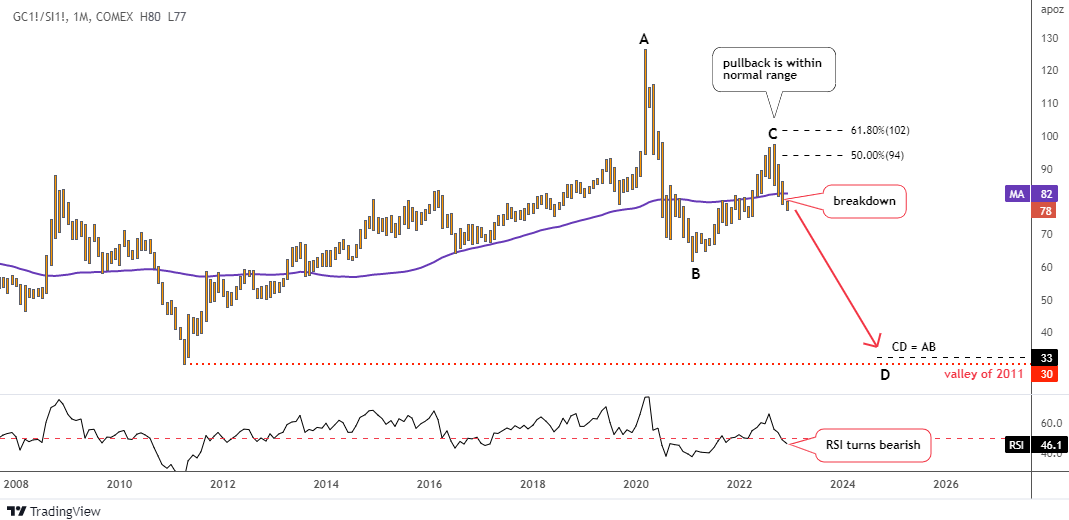
The chart above visualizes the comparative superiority of silver futures over gold futures that we revealed in the first graph. The white metal has been reversing its nine-year losses since the bottom of 2011 at 30 oz up to the all-time high at 127 oz in 2020, where the large age long cycle has been completed.
I wrote about it more than two years ago in the post titled "Diamond" Pattern Pushed Gold To Sky Vs. Silver. That piece has attracted a lot of attention as it was shared more than two hundred times with a bunch of your valuable comments.
From the record-high price in 2020 to 2021, the ratio has been falling heavily as it lost half of its value from 127 oz to 62 oz. I marked it as the AB segment within a larger model.
The next stage was a pullback that was close to hitting the 61.8% Fibonacci retracement at 102 oz. At 98 oz, the ratio has peaked slightly lower as marked by the letter C.
The downtrend that followed broke out instantly pushing the price back into the old range that was established between the peak of 2008 at 88 oz and the valley of 2011 at 30 oz.
Last month, the ratio closed below the strong support of the purple moving average. The RSI indicator has confirmed that move as well sinking below the crucial 50 level into a bearish area.
The CD part would touch 33 oz once it travels the same distance as the AB segment. It is close to the bottom of 2011 at 30 oz. The ratio should lose more than half of its current value to get there. Indeed, it’s a huge gain for silver.
Unless the ratio breaks below the bottom of 2021 at 62 oz, this scenario would be doubtful. The invalidation trigger sits at the current maximum of 98 oz established in September.
Back in September, I’ve shown you an interesting chart of correlation between the Gold/Silver ratio and the S&P 500 index.
In regular conditions, these instruments have the opposite dynamics. The ratio acts as a barometer of risk on/risk off sentiment in the market. The expected price decline alongside silver's strength versus gold could protect the S&P 500 index from further collapse, although its effects may take some time to materialize.
Intelligent trades!
Aibek Burabayev
INO.com Contributor
Disclosure: This contributor has no positions in any stocks mentioned in this article. This article is the opinion of the contributor themselves. The above is a matter of opinion provided for general information purposes only and is not intended as investment advice. This contributor is not receiving compensation (other than from INO.com) for their opinion.