MarketClub's Flash charts come complete with a set of technical tools that are easily integrated with various trading styles. Find your perfect chart type and combination of studies, and it will be saved to your charting template to be recalled for any chart you pull up.
Below is a video tutorial, as well as the most frequently asked questions and answers to help you get the most out of your charting.
Please contact support for additional help setting up your charts.
Return To Help Section Homepage
FAQs
How do I customize my chart settings?
How do I save my chart settings?
How do I use the On-Chart Studies?
How do I use the Below-Chart Studies?
How do I use the Trend Line tool?
How do I use the Fibonacci Retracement tool?
How do I access the Talking Chart technology?
How do I print a chart?
How do I customize my chart settings?
Use the toolbars at the top of your chart body to change your chart type, charting span, and charting increment. You can also add and remove the Trade Triangles and various technical studies and tools.
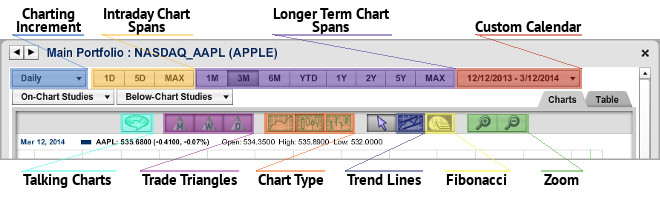
Charting Increment - Use this drop-down menu to select your charting increment. You can choose from intraday charting increments as well as daily, weekly, and monthly levels. Be sure your charting is set to a daily or longer time frame to view the Trade Triangles.
Intraday Chart Spans - Use these buttons to select your intra-day data charting span. You can choose one day (1D) or five day (5D), or the MAX option will chart all intraday data available.
Longer-Term Chart Spans - Use these buttons to select your charting span for daily and longer charting increments. You can choose one month (1M), three months (3M), six months (6M), year-to-date (YTD), one year (1Y), two years (2Y), five years (5Y), or the MAX option will show all data available. Use the calendar button to select a custom time frame.
Custom Calendar - Use this calendar drop-down menu to open two small calendars. Select your desired start and end dates for your custom charting span.
Talking Charts - Click this icon to play our Talking Chart technology. Make sure your speakers are on to listen to an analyst’s perspective of the market based on our proprietary tools.
Monthly Trade Triangle - Click to add the Monthly Trade Triangles to the chart. These Triangles appear on the chart with an "M" inside.
Weekly Trade Triangle - Click to add the Weekly Trade Triangles to the chart. These Triangles appear on the chart with a "W" inside.
Daily Trade Triangle - Click to add the Daily Trade Triangles to the chart. These Triangles appear on the chart as smaller, solid Triangles.
Line Chart - Click on this icon to convert your data points into a line chart.
Candlestick Chart - Click on this icon to convert your data points into a candlestick chart.
Bar Chart - Click on this icon to convert your data points into a bar chart.
Arrow - Click this button to exit the Fibonacci Retracement tool or the Trend Line tool. You are now able to add other studies, change time frame, or perform other tasks.
Trend Line - Click this button to use your Trend Line tool. Move your mouse onto your chart, then click, drag, and release to draw the trend line.
Fibonacci - Click this button to use your Fibonacci Retracement tool. Move your mouse onto the first point on the chart, then click, drag, and release the mouse to draw the Fibonacci retracement lines.
Zoom - Click to narrow or broaden a specific time frame.
How do I use the On-Chart Studies?
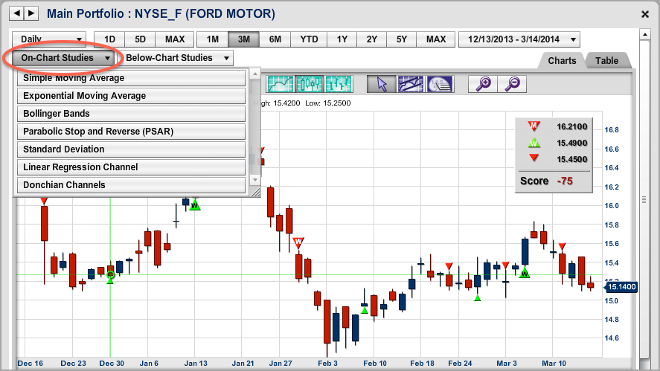
MarketClub offers 7 different studies that you can apply directly to the body of your streaming chart. You may apply all of the studies at once if you choose. For a detailed description of each available study, please see this page.
To Apply a Study: Click on the On-Chart Studies drop-down to open the menu of studies available. Click on the name of the study you wish to apply and slide the tab if you wish to change the study's default settings. The default settings can be re-applied by clicking on the "Reset" link found at the bottom of the study's settings box.
To Remove a Study: Click on the On-Chart Studies drop-down to open the menu of studies available. Applied studies will appear shaded a darker grey. Click on the name of the applied study to remove it.
How do I use the Below-Chart Studies?
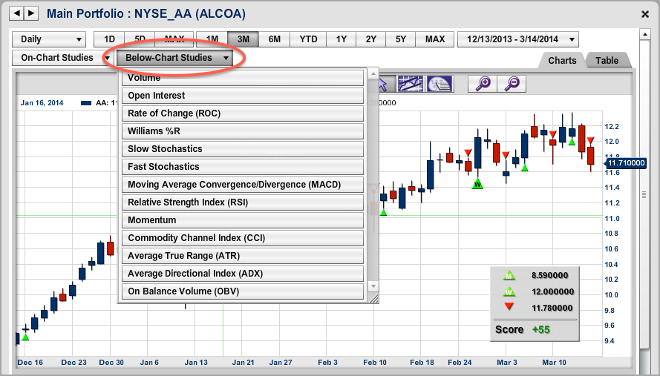
MarketClub offers 13 different studies that you can apply below your streaming chart. Manage up to 3 studies at one time using the Below-Chart Studies drop-down menu. For a detailed description of each available study, please see this page.
To Apply a Study: Click on the Below-Chart Studies drop down to open the menu of studies available. Click on the name of the study you wish to apply and slide the tab if you wish to change the study's default settings. The default settings can be re-applied by clicking on the "Reset" link found at the bottom of the study's settings box.
To Remove a Study: Click on the Below-Chart Studies drop down to open the menu of studies available. Applied studies will appear shaded a darker grey. Click on the name of the applied study to remove it.
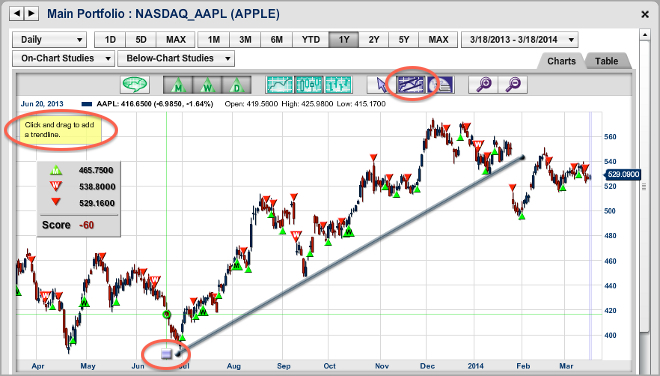
How do I use the Trend Line tool?
One important tool that technical analysts utilize is the Trend Line. Many uses have been developed, but the most important idea is that Trend Lines can help spot important chart movements. They may serve to help identify significant price points when determining trends, breakouts, and resistance areas.
To Draw a Trend Line: Click on the Trend Line tool button. A yellow box will appear in the upper left-hand corner of your chart to indicate that you have chosen the Trend Line tool. Move your mouse over the chart to the area where you would like to start your Trend Line. Click, drag, and then release at the point you would like to end your Trend Line. This will create a gray line with two round balls on the ends. There is no limit to how many Trend Lines you can draw on a chart at one time.
To Move a Trend Line: Click on the round ball at either end of the Trend Line you would like to move. Then drag your mouse and release it wherever you would like. You can use this to alter the angle or length of each side of a Trend Line.
To Remove a Trend Line: Move your mouse over to the left-hand point of your Trend Line until you see a small grey box appear. Click on the box to remove the line.
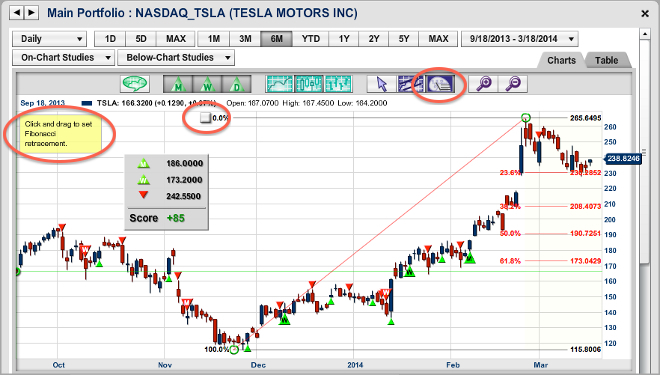
How do I use the Fibonacci Retracement tool?
Use your Fibonacci Retracement tool to help you determine significant price points and retracement levels.
To draw Fibonacci Lines: Click on the Fibonacci Retracement tool button. A yellow box will appear in the upper left-hand corner of your chart to indicate that you have chosen the Fibonacci tool. Move your mouse over the chart to the area where you would like to start your Fibonacci retracement. Click, drag, and then release at the desired data points.
To move your Fibonacci Lines: Click on the green circle at either end of the diagonal line on your retracement. Then drag your mouse and release it wherever you would like.
To Remove your Fibonacci Lines: Move your mouse over to the upper left-hand side of your Fibonacci retracement lines until you see a small grey box appear. Click on the box to remove the lines.
How do I save my chart settings?
Our Flash charts will automatically save your chart settings. Every time you recall a chart, your studies (with the exception of trend lines) are placed on your chart the way you left them.
Since the trend lines are specific to each market and change as price action changes, the trend lines will not save and will have to be redrawn.
Since your Fibonacci Retracement lines are very specific to each market, the lines will only save to the market you applied the Fibonacci tool to.
How do I access the Talking Chart technology?
Turn on your speakers and click the Talking Chart button at the top of any chart to hear a verbal analysis of the market based on our proprietary indicators and scoring tools. The audio analysis will be based on price action and the Chart Analysis Score that corresponds with the specific market characteristics of the symbol you have selected.
For PCs:
1) Open the chart you would like to print and be sure all the data you would like to capture is visible on the screen. Press the Ctrl + Print Scrn buttons.
2) Open your Paint program from your Accessory file.
3) Paste your image into your Paint program.
4) You can then crop and alter the image if you desire.
5) Be sure that your Orientation and Scaling options are set appropriately. Print.
For Macs:
1) When you have your chart pulled up, right click and choose print.
2) Click preview and adjust the Orientation and Scaling options accordingly.
3) Print.
Return To Help Section Homepage
Back To Top